The StockMojo Option Strategy Builder is a free-to-start visual tool for designing multi-leg option trades on the Nifty, Bank Nifty and any stock or index in India’s F&O segment. You pick an underlying and an expiry, add your buy and sell legs — or drop in one of 30 ready-made strategies — and it draws the combined payoff on live prices while working out your max profit, max loss, margin, probability of profit and breakevens as you go. Whether you’re building a Nifty option strategy, a Bank Nifty spread or a position on an F&O stock, the workflow is the same — and this is a section-by-section walkthrough of it.
What the Strategy Builder does
An option strategy builder lets you combine several option legs into one position and instantly see the combined payoff, risk and Greeks before you place the trade. So at its core, the StockMojo builder answers one question before you risk a rupee: if I put on this exact set of legs, what happens? It plots the profit-and-loss curve of your whole position across every expiry price, marks where you make money and where you lose it, and prices it all on live data — the payoff that once needed a spreadsheet and manual recalculation now redraws the instant you change a strike.
It fits every experience level. Beginners use the presets to see a strategy’s shape — an iron condor’s flat middle and its two risk tails land far faster as a picture than as a paragraph. Intermediate traders test sensitivities: move the short strike out a notch and watch the breakeven and max profit shift. Advanced and professional traders run it as a pre-trade checklist — exact SPAN-style margin, every breakeven and the net Greeks before sizing a position, so risk is measured, not guessed.
Choose a symbol and expiry
Start at the dropdown on the top-left and pick your underlying — the Nifty, Bank Nifty or Fin Nifty, the BSE’s Sensex, or any stock in the F&O list. Choose an expiry — weekly or monthly — and the builder loads that chain’s live strikes, premiums, IV and Greeks. A status indicator on the right shows the data is live and ticking; outside market hours it falls back to the last traded prices.
One thing to know up front: switching the underlying wipes the legs you’ve built. The tool warns you first (“you will lose all your progress”), because a Bank Nifty 52,000 call makes no sense sitting next to Nifty legs. Decide your symbol, then build. If you want to eyeball the raw strikes alongside it, keep the Nifty option chain open in another tab.
Add your legs
A leg is a single option contract you buy or sell; a position is just a stack of legs, and you add them one at a time. For each leg you set four things:
- Buy or Sell — long (you pay premium) or short (you collect it).
- Call or Put — CE or PE.
- Strike — pick it straight off the option chain; ATM strikes are highlighted.
- Lots — how many. Each symbol trades in a fixed lot size set by the exchange (the Nifty in lots of 65), so your quantity moves in lot multiples, never single shares.
The entry price auto-fills from the strike’s last traded price and stays editable, so you can model a fill that’s a little better or worse than the screen. Each leg lands in the positions table with its own row — direction, strike, expiry, quantity, entry and live P&L — and you can attach a stop-loss or target per leg if you’re using it to manage a live trade. Stack a second leg and you’ve got a spread; stack four and you’ve got a condor. The payoff and the numbers recalculate on every change.
30 ready-made strategies
Building leg-by-leg is the flexible way. The fast way is the presets. Open the strategy menu and you get 30 ready-made strategies across four tabs:
- Bullish (8) — Buy Call, Sell Put, Bull Call Spread, Bull Put Spread, Long Calendar with Calls, Bull Condor, Bull Butterfly, Range Forward.
- Bearish (8) — Buy Put, Sell Call, Bear Call Spread, Bear Put Spread, Long Calendar with Puts, Bear Condor, Bear Butterfly, Risk Reversal.
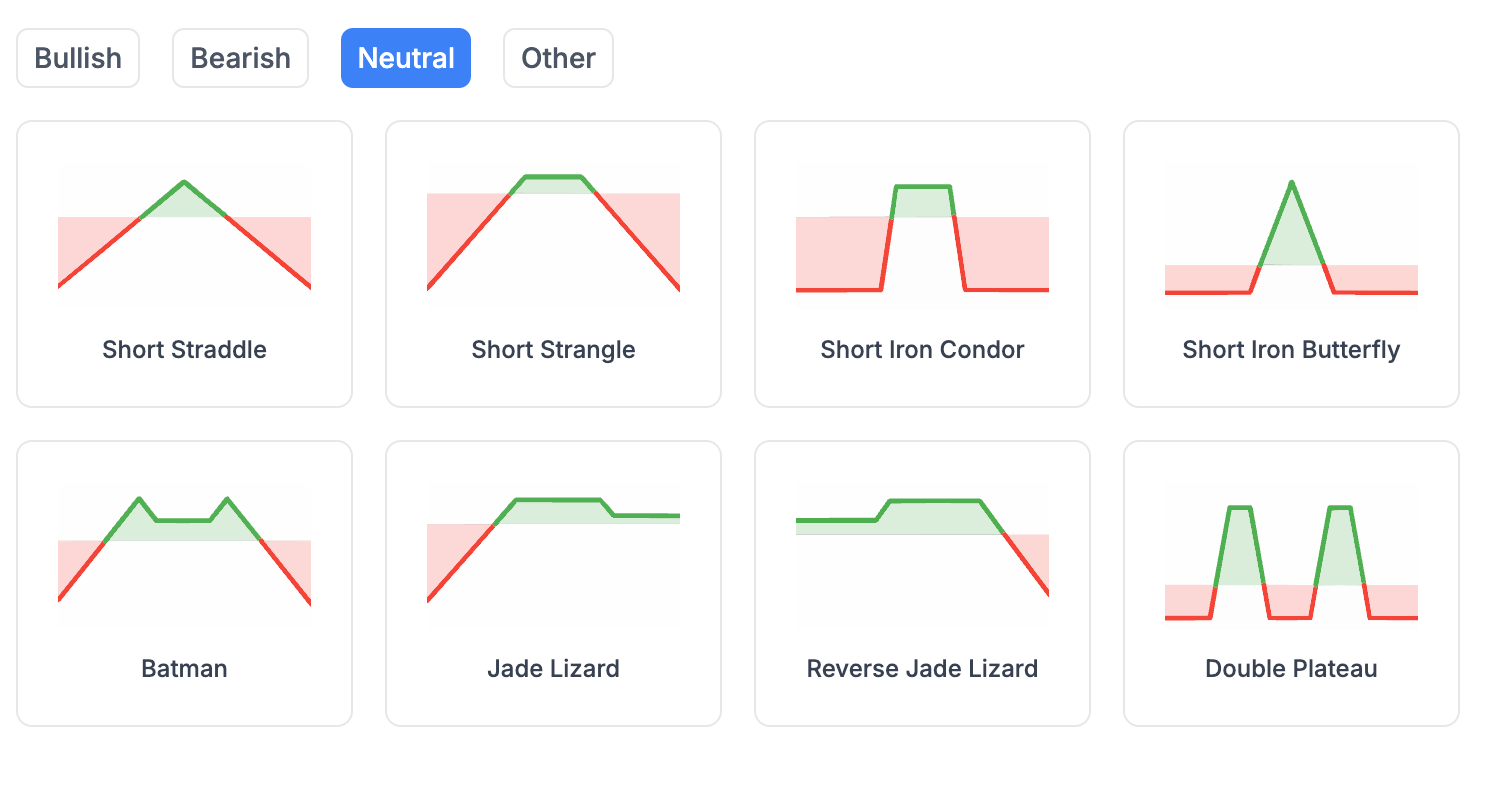
- Neutral (8) — Short Straddle, Short Strangle, Short Iron Condor, Short Iron Butterfly, Batman, Jade Lizard, Reverse Jade Lizard, Double Plateau.
- Other (6) — Long Straddle, Long Strangle, Long Iron Condor, Long Iron Butterfly, Call Ratio Spread, Put Ratio Spread.
 Open the Strategy Builder
 Pick any of them and the builder lays out the legs for you, anchored to the current ATM strike — a Short Straddle sells the ATM call and put, a Short Iron Condor sells a strangle and buys wings outside it, and so on. They range from a single leg (Buy Call) to four-leg structures like the iron condor, up to the eight-leg Double Plateau. If you’re specifically after an iron condor or a straddle, the Neutral tab is where to start; to see what the ATM straddle is pricing across expiries first, the straddle chart is a useful companion. Treat a preset as a starting point, not gospel: once it’s on the chart, drag the strikes to your own levels and the payoff follows. New to a shape? Read the mechanics first — our bull call spread guide walks through strike choice, the every-scenario payoff and how to manage it.
Reading the payoff chart
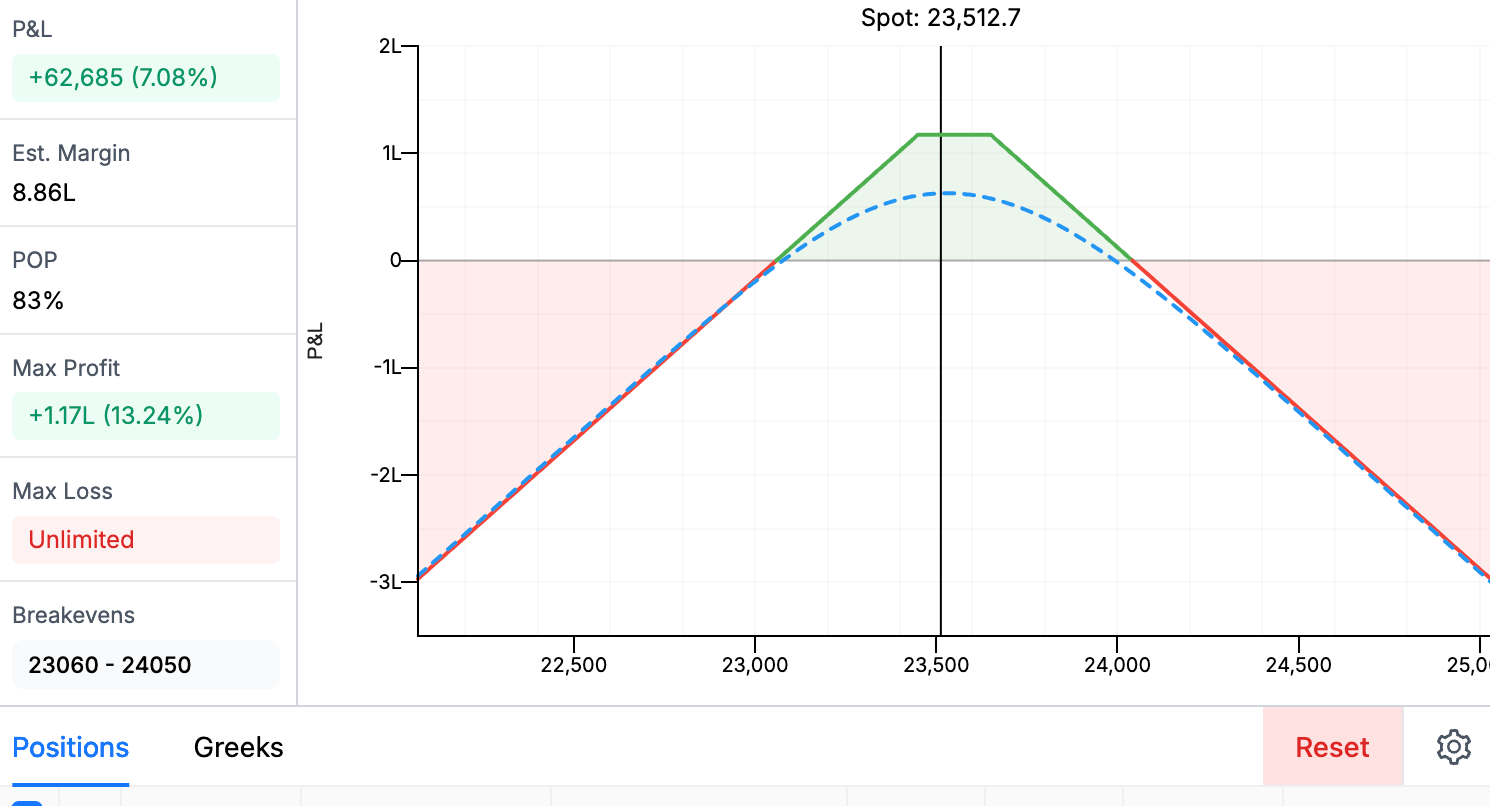
The chart is the heart of the tool. The x-axis is the underlying price at expiry; the y-axis is your P&L in rupees (large values shorten to L for lakh and Cr for crore). Two lines tell the story:
- The solid line is P&L at expiry — where you stand if you hold to the last tick.
- The dashed line is P&L today — your mark-to-market (current) P&L right now, before time decay and the rest of the move have played out.
 Open the Strategy Builder
 Green shading is profit, red is loss, and a vertical marker pins the current spot so you can see how far the price has to travel. Hover anywhere on the curve to read the exact P&L at that price, both today and at expiry. The gap between the two lines is, in effect, the time value still left in the trade — watch it close as expiry approaches.
The numbers that matter
Beside the chart sits a panel of six live figures — P&L, estimated margin, POP, max profit, max loss and breakevens. These are the numbers to size a trade by:
| Metric | What it tells you |
|---|---|
| P&L | Current profit or loss on the position, and what that is as a % of the margin blocked. |
| Est. Margin | An estimate of the SPAN + exposure margin your broker will block — small for defined-risk debit spreads, larger for anything with a naked short. It varies by broker and moves intraday, so treat it as a guide. |
| POP | Probability of profit: the estimated chance the position finishes green at expiry. |
| Max Profit | The best case — or “Unlimited” when the upside is open-ended (e.g. a long call). |
| Max Loss | The worst case — or “Unlimited” for an uncovered short option. |
| Breakevens | The price(s) where P&L is zero, each shown with its distance from spot in %. |
iRead POP next to Max Loss, never alone. A short strangle can show an 80%+ probability of profit and still carry an unlimited max loss — the odds are good, but the tail is brutal. High POP is not the same as low risk.
Combined Greeks
Switch to the Greeks tab and the panel sums the Greeks across every leg, signed for direction — a long leg adds, a short leg subtracts — so you see the position’s true net exposure:
- Delta — net direction. Positive means you want the underlying up; near zero means you’ve built something market-neutral.
- Theta — daily time decay. Positive theta (net seller) collects a little each day the underlying sits still; negative theta (net buyer) bleeds a little each day nothing happens.
- Vega — sensitivity to implied volatility. Short vega gains if IV falls; long vega gains if it rises. Check the IV chart to see where IV sits versus its recent range before you put on a vega bet.
- Gamma — how fast your delta changes as spot moves. Near expiry, short gamma is what turns a small move against you into a fast, outsized loss — the reason short options need watching in the last few days.
(Rho, the interest-rate sensitivity, is negligible for short-dated options and isn’t shown.) This is where a payoff shape becomes a risk profile: a short straddle reads as roughly delta-neutral, strongly positive theta and short vega — it earns on calm, decaying days and gets hurt by a volatility spike. Seeing that before you trade is the whole point.
Settings worth knowing
A few controls quietly change what you see:
- ATM reference — the builder can define the at-the-money strike off the spot, the futures price, or a synthetic future. It matters more than it sounds: index futures usually trade at a small premium to spot, so the “ATM” strike — and every preset built around it — can shift by a strike. If spot is 24,950 but the front-month future is 25,020, setting the reference to Futures makes 25,000 the ATM strike instead of 24,900, and a preset straddle will sell the 25,000 call and put rather than the 24,900 pair. On weekly expiries that difference in premium adds up.
- Strike range — how many strikes around ATM the chain shows. Widen it for far-OTM wings, tighten it to cut noise.
- Per-lot vs total — view premiums, margin and P&L for a single lot or for your full quantity. Switch to per-lot when you’re comparing strikes, back to total before you size the order.
The defaults work fine on day one. Come back to these once you’ve built a few trades and want to calibrate more precisely.
Save and paper-trade
Built something you like? Hit Save and it’s stored to your account; the Saved panel lists each strategy with its symbol, number of legs and current P&L, and lets you reload or delete it. With a saved strategy open you can flip on Auto-save so tweaks persist automatically — handy when you’re managing a paper position and don’t want to lose a strike or quantity change if you close the tab.
Building strategies and reading the payoff is free to get started. Saving them, switching the underlying and StockMojo’s other premium tools sit on a paid plan — you get limited free access to try everything first, and some features stay free for good. The pricing page has the current options.
Saving is also what turns the builder into a paper-trading book. Because each leg keeps its entry price, a saved strategy tracks two P&L numbers as the days pass — the open P&L on legs you’re still holding and the realised P&L on legs you’ve squared off — so you can practice managing a real position, on real prices, without real money on the line. Enter a bull call spread, watch it through an expiry, square off and see how you actually did.
That’s the forward-looking cousin of the Options Simulator, which runs the other direction: it loads historical chains so you can back-test a strategy across past sessions in minutes. Paper-trade in the builder to rehearse execution; back-test in the simulator to pressure-test the idea.
Worked example: bull call spread
Say the Nifty’s near 25,000 and you’re moderately bullish. Open the builder, choose Nifty and a weekly expiry, then go to Bullish → Bull Call Spread. It buys the at-the-money 25,000 call and sells a higher 25,300 call, and the chart snaps to the classic capped shape below.
The panel does the arithmetic for you: a net debit that is your max loss (₹7,150), a capped max profit (₹12,350) above 25,300, and a breakeven at 25,110. Nudge the short strike higher and you’ll watch the max profit grow and the cost rise with it — exactly the trade-off you’re weighing. For the full mechanics — strike and expiry selection, every expiry scenario, the Greeks and how to manage or exit it — read the bull call spread guide, then come back and build your own version.
This walkthrough is about how the tool works, not a trade recommendation — options carry real risk, and short positions can lose far more than they take in, so size every trade against the margin and max-loss numbers in front of you. When you’re ready, open the Strategy Builder and start with a preset.