Nifty Advance Decline Ratio Live — NSE Market Breadth & Sector Tracker
Advance / Decline
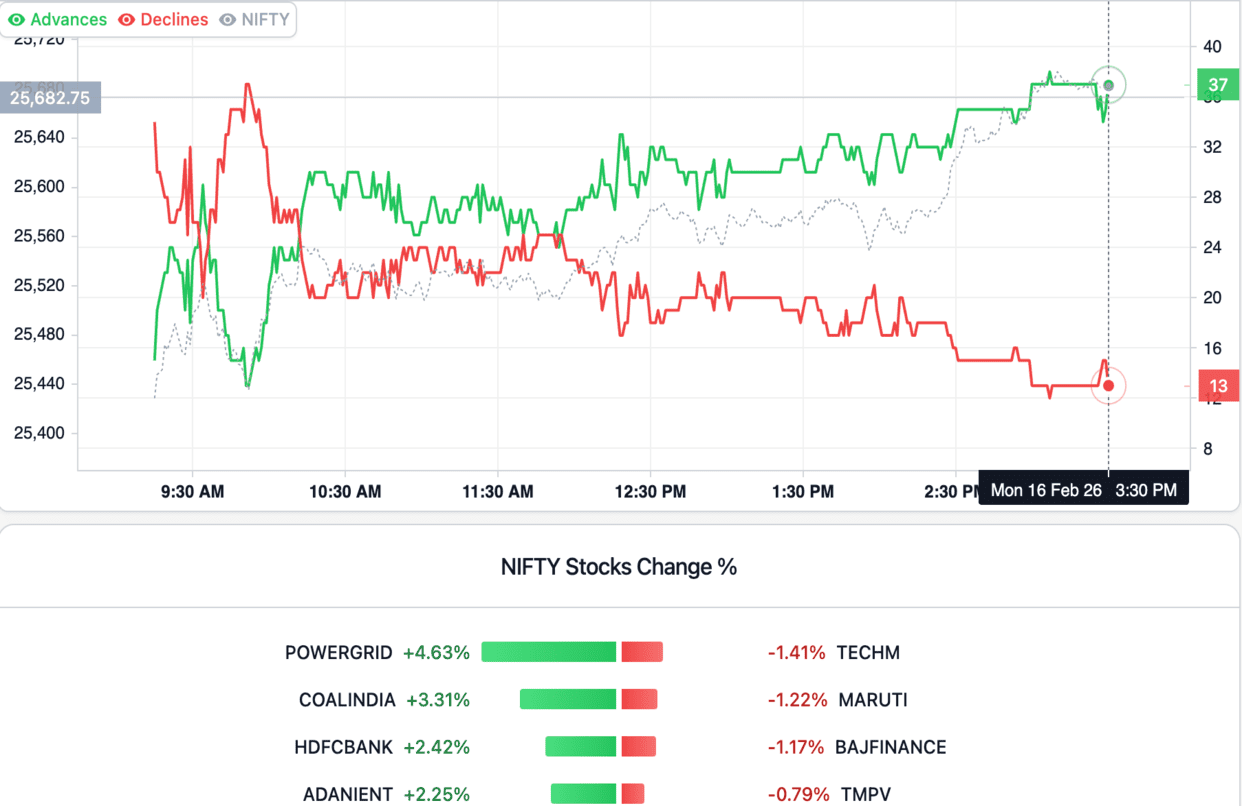
NIFTY Advance / Decline
NIFTY Stocks Change %
About the Advance Decline Ratio
Market breadth in one number. The advance-decline ratio counts how many Nifty 50 stocks are up versus down right now, regardless of where the index level itself sits. A 45/5 reading is a broad-based rally that tends to last. A 20/30 reading with the index still green means a few heavyweights are carrying the day while everything underneath is sliding. Two very different markets, one identical headline.
Breadth divergences are among the most reliable reversal signals on NSE. The 2024 election rally and the early 2024 small-cap correction both showed up cleanly in advance-decline before they were obvious in price. When Nifty pushes a new high but breadth is already weakening, that is the classic narrow-leadership warning. When Nifty makes new lows but advances stop falling, selling is exhausting and bottoms tend to follow within a few sessions.
Using ADR for trading decisions
Intraday traders treat ADR as a confirmation filter. Take long directional trades only when advances dominate. Take shorts only when declines do. For positional traders, the cumulative A-D line is the longer-frame view, and it usually tops out weeks before the index does at major reversals. Toggle between Nifty 50 and sectoral breadth to see which segment is actually doing the work on any given day.
Combine ADR with our Index Contributors, Index Weightage, and Market Movers for a fuller breadth research stack.
Frequently Asked Questions
What is the advance-decline ratio?
The advance-decline ratio (ADR) measures market breadth by counting how many stocks are advancing versus declining within an index. The simple formula is advances divided by declines, with 1.0 as the critical level. Anything above 1.0 means more stocks are up than down (bullish breadth). Below 1.0 means decliners dominate (bearish). On a 40/10 Nifty 50 reading you get an ADR of 4.0, a broad rally. A 20/30 reading with the index flat exposes narrow leadership that the headline number is hiding.
How is the cumulative advance-decline line calculated?
Daily Net Advances equals the count of advancing stocks minus the count of declining stocks. The cumulative A-D Line is just the running sum: today's line value equals yesterday's line value plus today's Net Advances. The line itself is more useful than any single day's reading because it smooths the noise and shows the longer-frame breadth trajectory. Major tops and bottoms in Nifty often print weeks after the cumulative line has already turned.
Why does market breadth matter?
Breadth reveals the health of a trend. A rally backed by broad advances (most constituents up) tends to persist. A rally carried by a few heavyweights while the majority of stocks are down is structurally weak and often precedes corrections. Breadth is a leading indicator that price alone can't show.
What is a bullish breadth divergence?
A bullish divergence occurs when the index keeps making lower lows but ADR stops falling or starts rising. Fewer stocks are participating in the decline — selling pressure is exhausting. Bullish breadth divergences often precede intermediate-term bottoms by several sessions.
What is a bearish breadth divergence?
A bearish divergence is when the index makes new highs but ADR is already falling — fewer stocks are participating in the rally. The rally is being driven by heavyweights while broader participation weakens. This classic 'narrow leadership' pattern is among the most reliable reversal warnings.
Can I track advance-decline by sector?
Yes. Switch between Nifty 50 breadth and sectoral breadth (IT, banking, auto, pharma, metals, FMCG). Sectoral ADR often leads the headline index — when IT sector breadth collapses while Nifty 50 still looks fine, it signals which specific sector is dragging the market.
How do I use the cumulative A-D line?
The cumulative advance-decline line is the running sum of daily (advances − declines). It's a classic longer-timeframe breadth indicator. When it tops out weeks before the index tops, it's warning of an impending major reversal. When it bottoms before the index bottoms, it signals a durable recovery is starting.
How to use the Advance Decline Ratio
- Pick an index or sector — Select Nifty 50 for headline market breadth, BankNifty for financial sector, or pick a specific sector (IT, pharma, etc.) for narrower views.
- Check the current ratio — A ratio like 40/10 means 40 stocks advancing, 10 declining. Higher advances = broader participation = healthier trend.
- Compare to price — Compare ADR direction against index direction. Agreement = healthy trend. Disagreement = divergence warning.
- Watch the cumulative line — The cumulative A-D line reveals medium-term breadth trends. It often leads the index at major tops and bottoms by multiple sessions.
- Combine with index weightage — Cross-reference with Index Contributors to see if the breadth divergence is being masked by a few heavyweights.