Live NSE Market Movers — Index Movers, OI Spurts & Buildup Tracker
About Market Movers
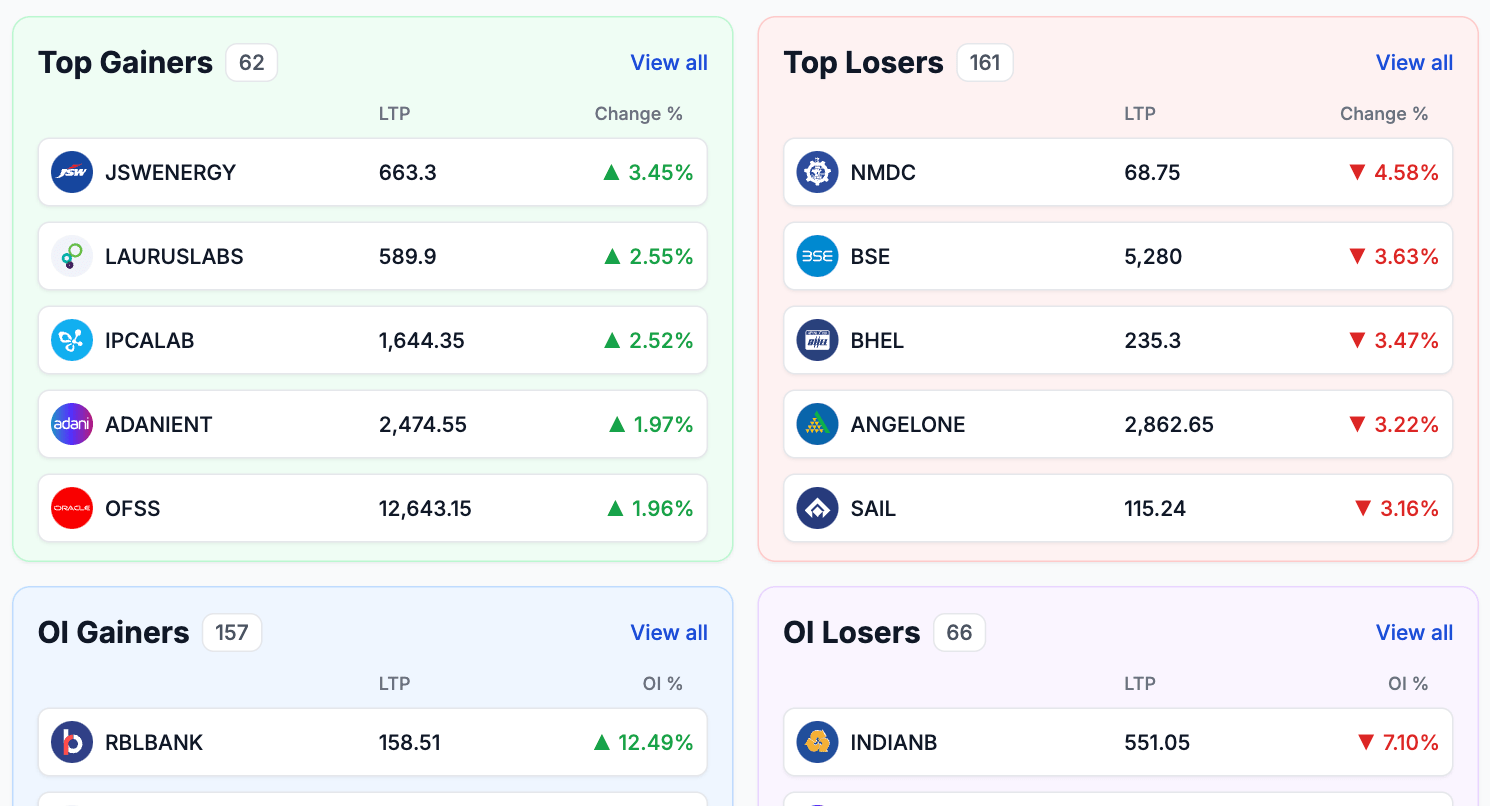
A live dashboard for the NSE stocks doing something worth a look right now. Four views cover the action. Top price gainers and losers (biggest percentage moves). OI spurt stocks (where positioning is changing most aggressively). Volume expansion names (where today's turnover dwarfs the average). Buildup classifications (long buildup, short buildup, long unwinding, short covering). The combination triages 200+ F&O names down to the handful actually worth opening a chart on.
A plain gainers list tells you only half the story. A stock up 4% might be a quiet drift or a violent institutional push, and price alone won't separate them. Market Movers cross-references price with OI and volume. Up 4% with a 25% OI add and 3x average volume is genuine commitment. Up 4% on flat OI and thin volume is position shuffling that usually fades within the day. The view makes that distinction obvious in seconds.
Using it for idea generation
Day traders scan the top gainers and OI spurt lists in the first 30 minutes of trade. Names appearing in both lists typically run the rest of the session. Positional traders watch buildup classifications across multiple days. Three consecutive sessions of long buildup in a stock is the cleanest multi-day bullish signal NSE produces. Sector-rotation traders use the sector filter. When several names from one sector cluster at the top of the gainers list, that's flow concentrating in one place.
Combine Market Movers with our F&O Market Movers, Intraday Booster, and OI Crossover Scanner for fuller NSE momentum analysis.
Frequently Asked Questions
What counts as a market mover?
We track four categories: top price gainers and losers (biggest percentage moves), volume spurt stocks (unusually high volume versus average), OI gainers and losers (largest absolute or percent OI changes), and buildup classifications (long buildup, short buildup, long unwinding, short covering). Combined, these identify the most meaningful action in NSE F&O.
Why combine price, volume, and OI?
Price alone is ambiguous — a stock up 3% could be quiet drift or violent institutional buying. Volume tells you whether the move is on real conviction. OI tells you whether fresh positions are being built or existing ones exited. All three together distinguish institutionally-supported trends from positional noise.
How often does the data refresh?
Every few seconds during NSE market hours (9:15 AM to 3:30 PM IST). Outside market hours, the last available snapshot is shown with a timestamp. The ranking recomputes as new ticks arrive, so top lists evolve through the session.
Can I filter movers by sector?
Yes. Each mover category supports sector filters — IT, banks, auto, pharma, metals, FMCG, and others. Sector filtering is how you catch rotation: when multiple names from one sector all appear in the top gainers list, broader sector-level buying is likely underway.
What time of day are movers most predictive?
First-hour movers (9:15-10:15 IST) often sustain through the session because institutional commitment is set early. Mid-day movers are less reliable. Final-hour movers (2:30-3:30) reveal positional intent for the next session — end-of-day long buildup is particularly useful for overnight holds.
Is this only for index stocks?
No. We cover the full NSE F&O universe — 200+ stocks plus all index futures. You can filter by Nifty 50, Nifty Next 50, BankNifty constituents, or individual sectors. For idea generation, broadening beyond Nifty 50 often reveals the best intraday opportunities.
How to use Market Movers
- Start with price gainers/losers — Scan the top gainers for potential longs and losers for potential shorts. Biggest movers anchor the session's leaders and laggards.
- Cross-check with OI — Stocks appearing in both price gainer AND OI spurt lists are institutionally-backed bullish setups. Price up + OI up = fresh commitment, not just short covering.
- Filter by sector — Apply sector filter to isolate where rotation is happening. Multiple names from one sector in the same list signals sector-level flow.
- Use buildup classifications — Long buildup for durable bullish setups, short covering for shorter bullish moves, short buildup for bearish setups, long unwinding for bounces.
- Drill into individual names — Click any stock to see its detailed price, OI, and option chain data. The mover lists are triage — the detail pages are where you decide trades.