Live ATM Straddle Premium Chart — Nifty, BankNifty & F&O Stocks
Nifty 50 (NIFTY) Straddle Chart: Identifying IV Crush
What is IV crush and how does it appear on the NIFTY chart?
IV crush is a sharp decline in implied volatility, usually triggered by an event resolving (RBI policy, budget announcement, election results). Before the event, options premiums are inflated because traders are hedging against uncertainty. After the event, uncertainty disappears and premiums collapse. On the NIFTY straddle chart, IV crush appears as a sharp, sudden drop in the straddle line — often in the first 15-30 minutes after the event.
Why IV crush is so important for NIFTY traders
If you bought Nifty 50 options before an event, you are at risk of IV crush even if NIFTY moves in your favoured direction. The IV collapse can wipe out your gains. If you correctly predicted the direction but still lost money, IV crush was probably the reason. Straddle sellers, on the other hand, benefit from IV crush — they profit both from theta decay and from the volatility contraction. Understanding this dynamic prevents the common mistake of buying expensive options before events.
Spotting pre-event IV inflation
In the days leading up to a major event, the NIFTY straddle chart typically rises steadily. You can see volatility being priced in as the event approaches. If the usual ATM straddle is around Rs. 150 and it rises to Rs. 250 over 3-4 sessions without Nifty 50 moving much, the extra Rs. 100 is pure IV inflation. This is your warning that premiums are about to crash once the event resolves.
Strategies around NIFTY IV crush
Strategy 1: Short straddle or iron condor before the event, captured the crush. Strategy 2: Wait for the event to pass, then buy options after IV has normalised — cheaper entry, direction still playable. Strategy 3: Avoid buying options in the 1-2 days before events. Strategy 4: Watch for IV crush patterns on the straddle chart to confirm when the crush has completed. As of 9 July 2026, these approaches help you navigate event-driven NIFTY volatility safely.
Nifty 50 (NIFTY) Straddle Chart: Reading Volatility Changes
How the NIFTY straddle reveals volatility shifts
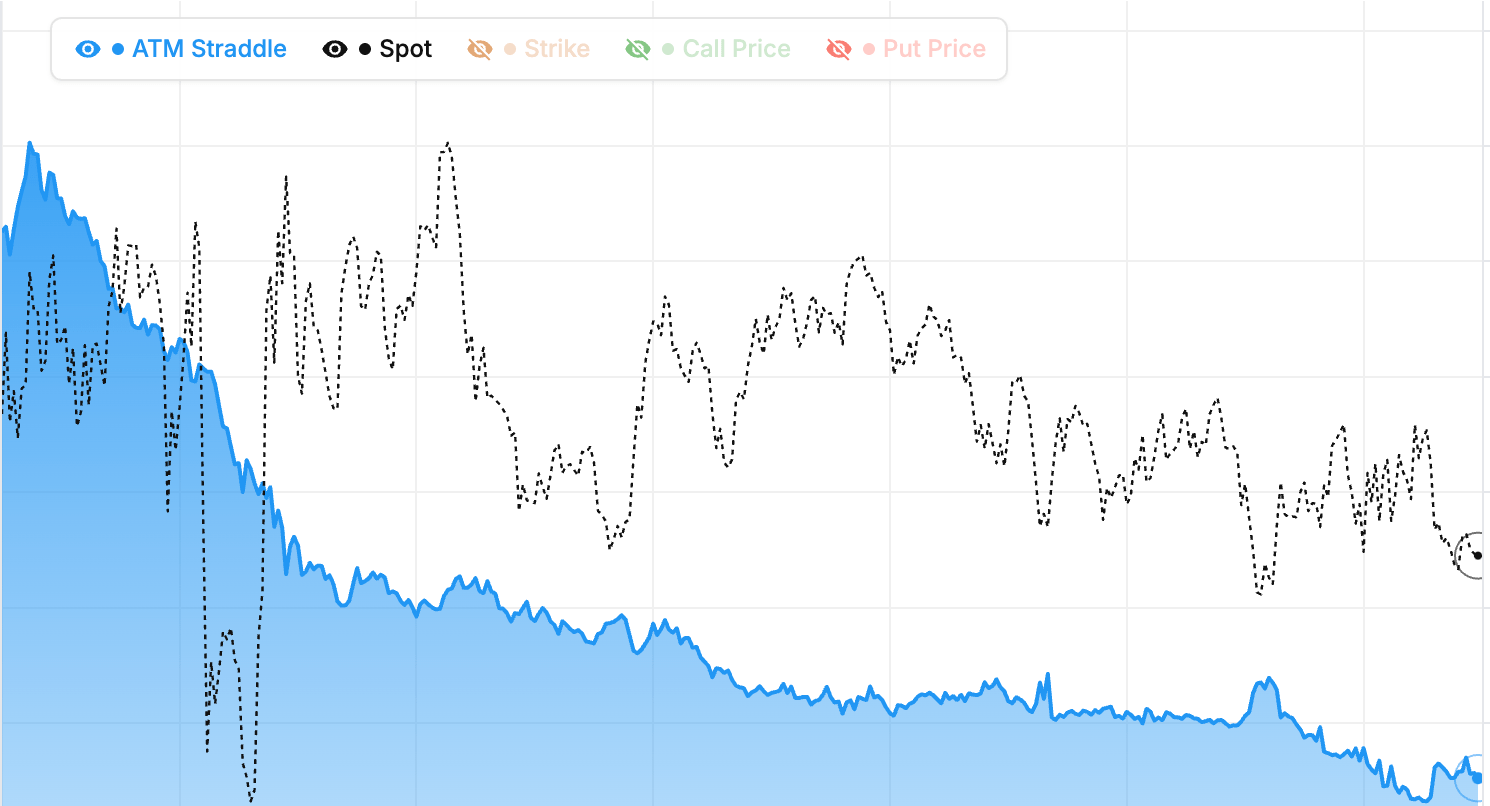
Volatility is an abstract concept — you cannot see it directly. But you can see it through the straddle chart. The Nifty 50 ATM straddle price is essentially a pure volatility instrument (when viewed through auto-rolling mode). Rising straddle = rising volatility. Falling straddle = falling volatility. This simple relationship makes the straddle chart one of the clearest volatility visualizations available for Indian options traders.
Volatility expansion signals on NIFTY
When the NIFTY straddle line rises meaningfully (say, 15-20% over a few hours), volatility is expanding. This often precedes a directional move or follows breaking news. Volatility expansion in Nifty 50 tends to cluster — once it starts, it often continues for several sessions. Recognising the expansion early gives you time to adjust strategies: avoid short premium, consider long premium, widen your expected move assumptions.
Volatility contraction signals on NIFTY
The opposite pattern — a sustained decline in the Nifty 50 straddle beyond normal theta decay — signals volatility contraction. This usually happens after events resolve or during extended range-bound periods. Contracted volatility is the ideal environment for premium selling. Short straddles, iron condors, and calendar spreads all benefit from falling volatility. As of 9 July 2026, a contracting straddle chart is an invitation to short premium with appropriate risk controls.
Using the chart shape to classify NIFTY volatility regimes
Different chart shapes correspond to different volatility regimes. Smooth gradual decline = stable low-volatility regime. Gradual rise = volatility is building, something is coming. Sharp spike followed by crash = event-driven volatility (before and after an event). Sideways with small zigzags = directional price action but stable volatility. Each regime calls for different trading tactics. Learning to read the chart shape gives you a fast classification system for Nifty 50 conditions.
About the ATM Straddle Chart
An ATM straddle is built by buying (or selling) a call and a put at the strike closest to spot, same expiry. For Nifty, if spot is 22,180, the ATM strike is 22,200 (Nifty strikes are 50 points apart, you pick the nearest). The combined premium of the 22,200 CE and 22,200 PE is the straddle price. That single number captures the market's expectation of how much Nifty will move before expiry.
Why traders watch it: the ATM straddle is the purest expression of implied volatility in rupee terms. When uncertainty rises, both call and put premiums rise, pushing the straddle higher. When the market is calm or directional, premiums contract and the straddle falls. A Nifty weekly straddle might trade at 250 points on Monday morning and decay to 50 points by Thursday 2:30 PM if Nifty stays range-bound. Time value erodes throughout the week.
Expected move from the straddle
The straddle gives a quick estimate of the market's expected move. Approximate formula: Expected Move ≈ Straddle Price × 0.85. The 0.85 factor accounts for the statistical distribution (one standard deviation covers ~68% of outcomes, and the straddle slightly overprices the true expected move). If the Nifty weekly straddle is at 200 points on Wednesday, expected move is roughly 170 points in either direction. So with spot at 22,200, the market expects Nifty between roughly 22,030 and 22,370.
For BankNifty, straddle premiums typically run 400-700 points for weekly expiry. Same 0.85 multiplier. If the BankNifty ATM straddle is 500, expected move is about 425. Use this range to set realistic targets. If you sell a straddle at 500 and BankNifty moves only 300, you still profit because the move was within the priced-in expectation.
Premium decay through the week
The chart plots combined ATM premium over time. Theta decay isn't linear. It accelerates as expiry approaches. Monday and Tuesday the straddle may lose 30-40 points per day. By Wednesday afternoon, 50-80. On Thursday (expiry day), the last 100 points can evaporate in a few hours. For straddle sellers, accelerating decay is the primary profit source. The ideal is Nifty opening near the ATM strike Thursday and barely moving. For straddle buyers, the chart shows the breakeven: the straddle has to expand beyond the premium paid.
Intraday signals
A sudden straddle-price spike without a corresponding spot move signals volatility expansion. Often precedes a breakout. A steadily declining straddle through the day confirms a low-vol, range-bound session that favours premium sellers. The chart is most useful in the first 30 minutes after open (9:15-9:45) when the opening straddle level sets the day's tone.
For a detailed view of how calls and puts decay individually, use our Premium Decay chart. For the volatility component driving the straddle, check the IV Chart.
ATM Straddle Chart: Video Walkthrough
Frequently Asked Questions
What is an ATM straddle and what does the straddle chart show?
An at-the-money straddle is the combined position of a call and a put at the same ATM strike and same expiry. The straddle chart plots the combined premium (call + put) of the ATM straddle over time. Watching this premium intraday reveals the market's real-time expected move and how aggressively that expectation is decaying.
How is straddle premium related to expected move?
The total premium of an ATM straddle is roughly equal to the market's expected move in the underlying through expiry, in either direction. If Nifty's weekly ATM straddle is priced at 200, the market is implicitly pricing a ~200 point move (up or down) before expiry. This is one of the cleanest forward-looking expectations available to retail traders.
Why does straddle premium decay throughout the day?
Two forces compress straddle premium: time decay (theta), which removes extrinsic value continuously, and any reduction in implied volatility. On expiry day both forces are at their most extreme, which is why ATM straddle premiums can lose 50-80% of their value in a single session.
What does a flat straddle premium chart indicate?
A flat or rising straddle premium during the session — when normal decay should be eroding it — indicates either an IV expansion (the market is pricing in higher uncertainty) or a directional move that's offsetting the decay. Both are warning signs for short-premium positions.
How can straddle decay help intraday option sellers?
Option sellers profit from the decay the chart visualizes. Selling ATM straddles at the open of expiry day and exiting before close has historically captured a meaningful portion of the day's decay — but the strategy carries unbounded risk if the underlying moves sharply. The chart helps sellers see the decay happening in real time and time their exits.
Straddle vs strangle — what's the difference?
A straddle uses the same strike for the call and put (always ATM by convention). A strangle uses different strikes — typically OTM call and OTM put. Strangles cost less but require larger moves to be profitable. The StockMojo tool focuses on the ATM straddle because it's the cleanest measure of expected move.
How do major events affect straddle premiums?
Pre-event, IV expansion inflates straddle premium because the market is uncertain about the outcome. Post-event, IV crash deflates the premium dramatically — even if the underlying moves sharply. This is why long straddles into earnings or RBI announcements often lose money even when the underlying moves the predicted direction.
How do I use the straddle chart on expiry day?
Watch the slope of the decay curve. A steep, smooth decay = a quiet market where short-premium strategies are working. A choppy or rising line = high realized volatility that's overwhelming the decay. Combine with Max Pain to identify the gravitational target the underlying is likely to drift toward.
How to use the Straddle Chart
- Pick an underlying and expiry — Select Nifty, BankNifty, or an F&O stock and choose the expiry to track.
- Read the current straddle premium — The latest value approximates the market's implied move through expiry.
- Look at the intraday slope — Steady decay means the market is range-bound; rising premium means IV is expanding or a move is underway.
- Compare with prior expiries — Use historical mode to see how today's straddle premium compares to the same time slot in previous weeks.
- Cross-reference with Max Pain — Combine the straddle reading (size of expected move) with the Max Pain strike (likely target) to plan an expiry-day setup.