FII DII Data Today — Live Institutional Trading & F&O Participant Summary
FII DII Cash Market Data (Last 15 Trading Days)
On 25 Jun 2026, FIIs were net buyers of ₹384 cr and DIIs were net buyers of ₹5,748 cr in the NSE cash market.
Last updated: 25 Jun 2026 · Provisional figures, published by NSE after 5:30 PM IST each trading day (figures in ₹ crore).
| Date | FII Buy | FII Sell | FII Net | DII Buy | DII Sell | DII Net |
|---|---|---|---|---|---|---|
| 25 Jun 2026 | 18,988 | 18,604 | 384 | 24,844 | 19,096 | 5,748 |
| 24 Jun 2026 | 16,745 | 18,588 | -1,843 | 17,274 | 13,637 | 3,637 |
| 23 Jun 2026 | 15,396 | 15,378 | 18 | 16,863 | 16,183 | 680 |
| 22 Jun 2026 | 10,082 | 10,718 | -636 | 17,392 | 16,356 | 1,036 |
| 19 Jun 2026 | 31,443 | 26,584 | 4,859 | 18,020 | 19,180 | -1,160 |
| 18 Jun 2026 | 14,612 | 15,637 | -1,025 | 16,163 | 12,646 | 3,517 |
| 17 Jun 2026 | 14,806 | 14,705 | 102 | 16,612 | 15,050 | 1,561 |
| 16 Jun 2026 | 13,887 | 14,636 | -749 | 13,553 | 13,553 | 0 |
| 15 Jun 2026 | 15,650 | 15,450 | 200 | 21,081 | 17,892 | 3,189 |
| 12 Jun 2026 | 12,065 | 13,147 | -1,082 | 18,877 | 13,536 | 5,341 |
| 11 Jun 2026 | 14,001 | 15,988 | -1,987 | 16,823 | 12,598 | 4,225 |
| 10 Jun 2026 | 14,048 | 16,173 | -2,125 | 17,396 | 14,272 | 3,124 |
| 9 Jun 2026 | 14,735 | 19,302 | -4,566 | 17,665 | 11,506 | 6,159 |
| 8 Jun 2026 | 8,842 | 14,398 | -5,556 | 16,683 | 11,518 | 5,165 |
| 5 Jun 2026 | 11,045 | 19,821 | -8,776 | 22,779 | 13,646 | 9,134 |
A positive net means institutions bought more than they sold that day. Use the live dashboard above for the F&O participant breakdown (Client, DII, FII, Pro) and the FII index futures long-short ratio.
Mastering FII and DII Data: A Guide to Institutional Trading Activity
To make informed decisions in the Indian stock market, follow where the money is flowing. FII (Foreign Institutional Investors) and DII (Domestic Institutional Investors) data offers a transparent look at how institutional players trade each day, helping retail traders decode whether sentiment is turning bullish or bearish. The cash-market figure is provisional after 5:30 PM IST; the F&O participant data shows how each category is positioned in index futures and options.
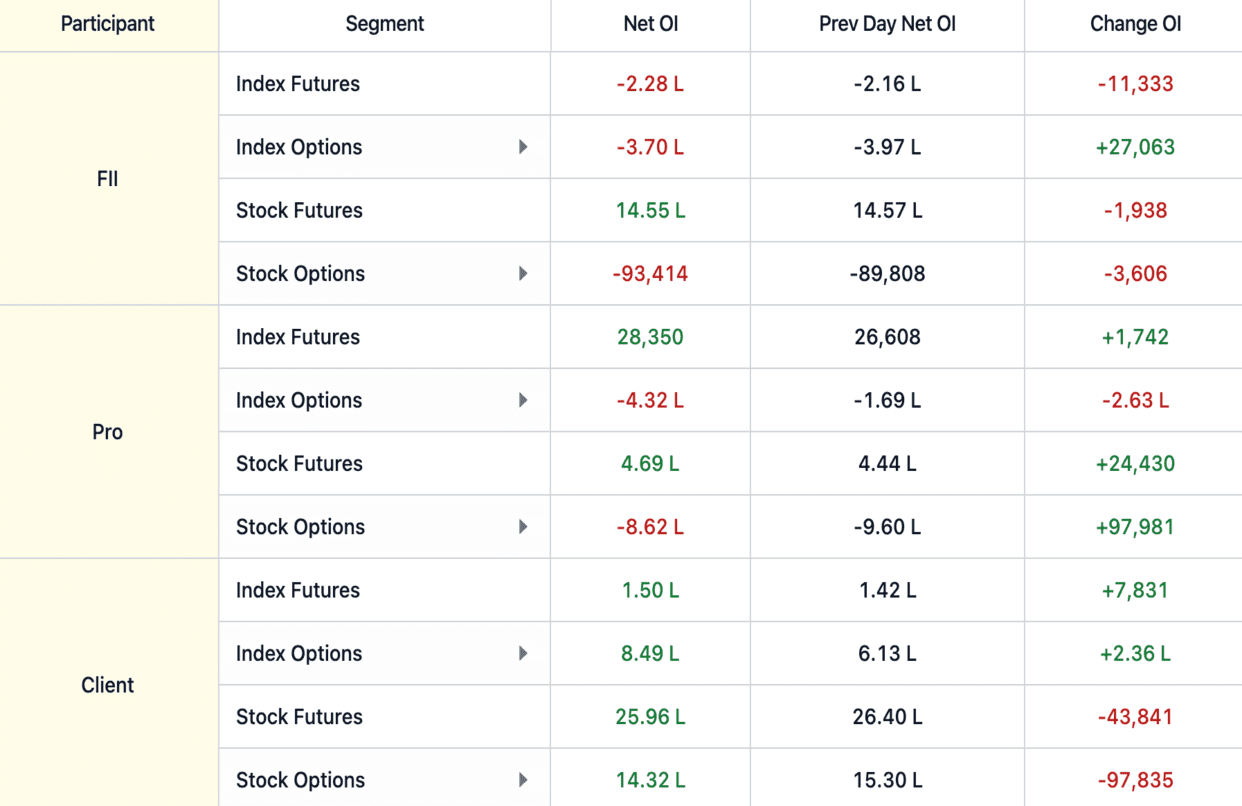
F&O participant activity decoded
Beyond cash-market numbers, the F&O participant metrics add context. NSE classifies participants into four categories:
- Client (Retail): individual traders. Markets often move against aggressive retail positioning.
- DII: domestic institutions taking structural long positions or hedging large cash portfolios.
- FII: the primary movers — heavy buying or shorting of index futures usually dictates the short-term trend.
- Pro (Proprietary Desk): sophisticated brokerage desks that typically write (sell) options to collect premium.
How to read the FII/DII dashboard
Watch extreme build-ups in open interest (OI). FIIs holding aggressive longs in index futures while accumulating index calls points to a strong bullish bias; shedding longs and shorting index futures is an early warning of a possible correction. FIIs sometimes short the broad indices to hedge while buying specific stock futures — tracking that divergence helps stock-specific swing trading even in a weak tape.
The key metric: FII index long-short ratio
The FII index futures long-to-short ratio tracks the share of FII positions that are long versus short. At historic lows (below ~20-30% long) the market is often oversold and prone to a short-covering bounce; above ~75-80% it may be overheated and due for a pullback. Combine cash-market flows with this ratio to build a higher-conviction setup rather than relying on any single figure.
Pair this summary with our FII DII Cash Market Charts for the longer daily series, Smart OI Detection for strike-level institutional positioning, and the Put-Call Ratio for options sentiment.
Frequently Asked Questions about FII DII Data
What is FII DII data?
FII DII data shows the daily buying and selling activity of Foreign Institutional Investors (FII) and Domestic Institutional Investors (DII) in Indian markets. It covers cash-market net buy/sell figures plus the F&O participant breakdown, and is the clearest read on where institutional money is flowing each day.
Where can I check FII DII data today for NSE?
Provisional FII and DII cash-market figures are published by NSE after 5:30 PM IST each trading day, with final figures later in the evening. This page shows the latest available NSE FII/DII cash net buy/sell, a daily history table, and the F&O participant breakdown (Client, DII, FII, Pro).
What is the difference between FII and DII?
FII (Foreign Institutional Investors) are foreign entities investing in Indian markets — foreign funds, hedge funds and sovereign wealth funds. DII (Domestic Institutional Investors) are Indian institutions such as LIC, mutual funds and insurers. FII flows tend to move the rupee and large-cap leadership, while DII flows often act as a counter-balance that adds stability.
How do I use FII DII data for trading?
FII buying is generally read as bullish as it brings foreign capital, while sustained FII selling can signal caution. DIIs frequently absorb FII selling, so analyse both together. For short-term reads, combine cash flows with the F&O participant data — especially the FII index futures long-short ratio — to gauge derivatives positioning.
Does heavy FII selling mean the market will crash?
Not necessarily. Thanks to the structural rise in domestic SIP flows, DIIs frequently absorb heavy FII selling and prevent free-falls. The market trajectory is best judged by reading FII and DII activity together rather than either figure in isolation.
What is the FII index long-short ratio?
The FII index futures long-short ratio measures the share of FII positions that are long versus short. When it falls to historic extremes (e.g. below ~20-30% long) it flags an oversold market prone to short-covering bounces; above ~75-80% the market may be overheated and due for a pullback.