Nifty Contribution & Index Movers - Live NSE Today
Index Contribution
NIFTY Index Contribution
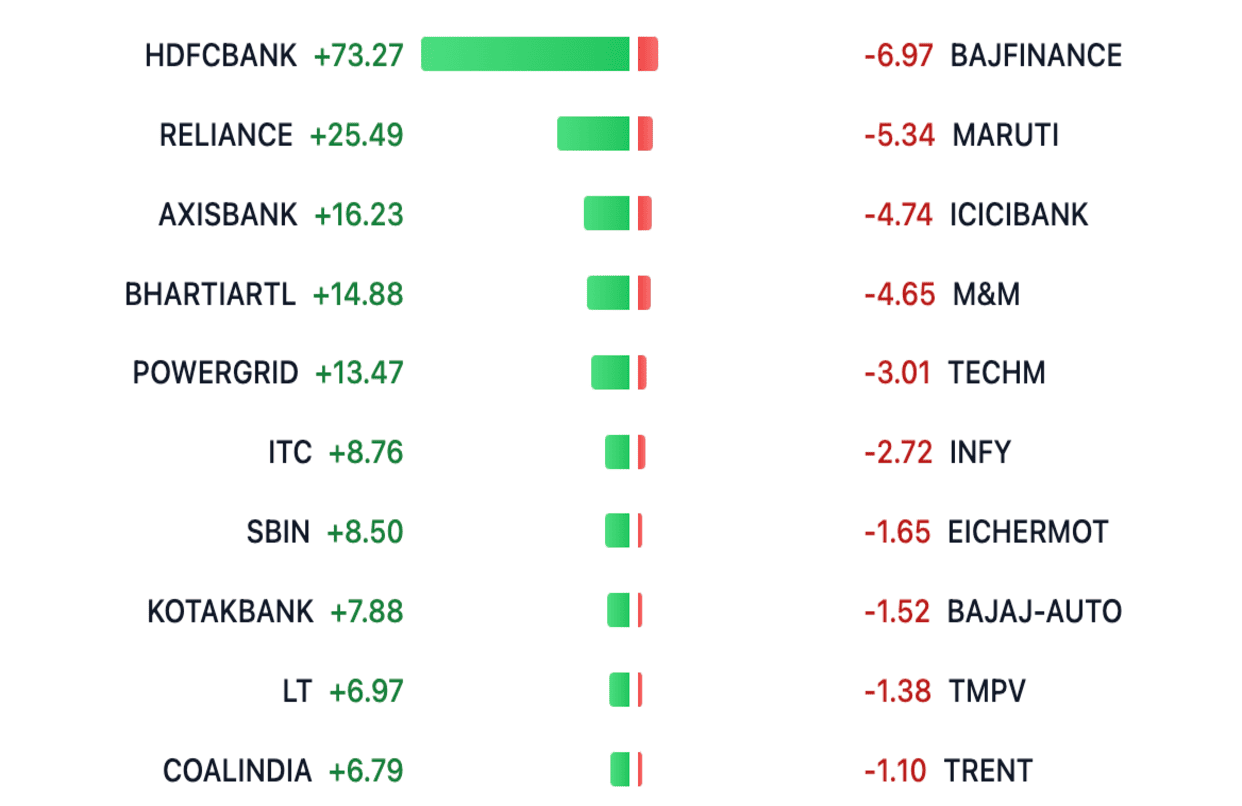
Positive Contributors
0NIFTY Points Contribution
Negative Contributors
0About Nifty Index Contributors
The tool decomposes every point of Nifty 50 (and BankNifty, FinNifty, Sensex) movement into the exact contribution from each individual stock. Instead of just "Nifty up 120 points," you see Reliance contributed 28 points, HDFC Bank 22, Infosys 18, while ITC subtracted 5 and HUL subtracted 3. A complete attribution of who actually drove today's move. The cleanest way to read the internals behind any index price action.
The math combines each stock's price change with its Nifty weightage. A 2% move in Reliance (around 9% weight) contributes more to Nifty than a 4% move in a smaller constituent. The tool surfaces top positive and top negative contributors live, sorted by absolute point impact, so it's immediately obvious which names are driving the index and which are dragging it. Contributions are split by source too: points from price change versus points from weight shift.
Using contributor data for NSE trade decisions
Directional Nifty traders use contributor data to validate breadth. If Nifty is up 100 points but 70 came from just Reliance, that's a narrow rally likely to fade. If the positive contribution is spread across 20+ stocks, the rally is broad-based and more likely to persist. Pair traders and sector rotators use it to spot rotation patterns in real time, often before they show up in sector indices. Hedgers use contributor data to size stock-level hedges based on actual index exposure rather than notional weight.
Combine contributor data with our Index Weightage, Advance Decline Ratio, and Market Movers for fuller NSE index internals research.
Nifty 50 Points Contribution Snapshot
Data as of 6 Oct 2026, 3:30 pm IST. The tool above shows live values during market hours; this snapshot refreshes with every site update.
As of 6 Oct 2026, 3:30 pm IST, Nifty 50 was at 22,776.10, up 220.3 points (+0.98%) versus the previous close. Positive contributors added 263.6 points while negative contributors dragged 43.2 points. RELIANCE added the most points (+45.3). COALINDIA dragged the most (-6.9).
Top Points Added
| Stock | Points | Change |
|---|---|---|
| RELIANCE | +45.3 | +2.66% |
| KOTAKBANK | +24.6 | +3.82% |
| TRENT | +23.8 | +12.64% |
| HDFCBANK | +22.5 | +0.94% |
| BHARTIARTL | +19.9 | +1.72% |
| ICICIBANK | +16.1 | +0.81% |
| AXISBANK | +15.8 | +2.11% |
| ETERNAL | +13.1 | +2.56% |
| BSE | +11.1 | +3.94% |
| HINDUNILVR | +11.0 | +3.09% |
Top Points Dragged
| Stock | Points | Change |
|---|---|---|
| COALINDIA | -6.9 | -3.16% |
| INFY | -5.0 | -0.65% |
| ITC | -4.5 | -0.82% |
| TECHM | -4.2 | -2.04% |
| BAJFINANCE | -4.1 | -0.71% |
| TCS | -3.0 | -0.68% |
| TITAN | -2.7 | -0.66% |
| ULTRACEMCO | -2.5 | -0.92% |
| MAXHEALTH | -2.5 | -1.58% |
| SHRIRAMFIN | -1.9 | -0.65% |
Frequently Asked Questions
What are index contributors?
Index contributors are the specific stocks pushing an index up or down by a given number of points. If Nifty 50 is up 120 points, the contributor tool shows exactly how many of those points came from Reliance, HDFC Bank, Infosys, etc. It decomposes index movement into stock-level attribution.
How is a stock's point contribution calculated?
Contribution equals the stock's percentage move multiplied by its index weightage, then scaled to the index's current level. A 2% move in Reliance (about 9% Nifty weight) contributes much more than a 4% move in a smaller constituent. The tool does this math live for every stock.
Why does this matter for traders?
Index moves look different depending on who's driving them. A 100-point Nifty rally with 70 points from Reliance alone is a narrow, heavyweight-led move likely to fade. A 100-point rally spread across 30+ stocks is broad-based and more durable. Contributor data reveals this distinction instantly.
Can I see contributors in real time?
Yes. During NSE market hours (9:15 AM - 3:40 PM IST), contributor data updates every few seconds alongside live stock prices. Outside market hours, the last close snapshot is shown with a timestamp.
Does this cover sectoral indices too?
Yes. In addition to Nifty 50 and BankNifty, the tool supports FinNifty, MidcpNifty, Sensex, and sectoral indices (IT, banking, auto, pharma, metals, FMCG). This is particularly useful for sector rotation traders tracking which names are actually driving sector-level moves.
How do I use negative contributors?
Negative contributors show you which stocks are holding back the index. In a flat Nifty day where ADR looks strong, a heavy negative contributor (e.g., Reliance down 2%) might be the reason the headline index isn't rallying. Knowing this lets you trade around the laggard rather than blindly betting on the index.
How to use Index Contributors
- Pick an index — Choose Nifty 50, BankNifty, FinNifty, Sensex, or any sectoral index you want to decompose.
- Sort by positive contribution — Identify the top contributors driving today's rally. Heavyweight concentration = narrow rally; broad participation = durable rally.
- Check the negatives — Sort by negative contribution to spot laggards dragging the index. These are your short candidates or names to avoid on the long side.
- Compare with breadth — Cross-reference with Advance Decline Ratio. When a 100-point rally comes from 5 stocks but most names are down, the rally is structurally weak.
- Refresh through the session — Contributor rankings change as the day progresses. Check again late morning and late afternoon to catch rotation.