NIFTY IV vs HV Chart | Volatility Premium & Discount Analysis
IV vs HV for NIFTY is the cleanest way to tell whether options on this underlying are cheap or expensive at any moment. Implied volatility (IV) is the volatility number baked into current NIFTY option prices — what the market expects going forward. Historical volatility (HV) is the actual standard deviation of past NIFTY returns over a chosen window — what the stock has actually done. The gap between the two tells you whether option buyers are over- or under-paying relative to recent reality.
When NIFTY IV is meaningfully above HV, the option market is pricing in more volatility than has actually been realized — premium is rich, and strategies like selling strangles, short straddles, and iron condors have favourable math. When IV drops below HV, option premium is cheap relative to the moves NIFTY has been making, and long-volatility strategies (long straddles, backspreads) get interesting. The ratio also reveals regime changes: a sustained IV-HV premium collapse often precedes breakouts, while expanding IV-HV premium usually marks complacency ahead of events.
Practical use of NIFTY IV-HV on NSE F&O
Most systematic option-selling strategies on NIFTY should filter entries by IV-HV gap — entering short-premium trades only when IV is sufficiently above HV compensates for the inherent tail risk. For event-day trades (budget, RBI, expiry), comparing current NIFTY IV with the HV you'd expect during the event window helps you decide whether the implied move is realistic, optimistic, or conservative — a crucial input for sizing and strike selection.
Combine IV vs HV with our IV Chart, Volatility Skew, and ATM Straddle Chart for a full NIFTY volatility analysis stack on NSE.
Nifty 50 (NIFTY) IV-HV: Frequently Asked Questions
How is HV calculated for NIFTY?
HV is calculated from daily Nifty 50 price changes over a chosen window (typically 20-30 days). The formula uses the standard deviation of log returns, annualized. The result is a percentage representing how much NIFTY has moved in annualised terms. The IV-HV chart handles the calculation automatically — you just need to understand what it represents.
How is IV calculated for NIFTY?
IV is derived from option premiums. Given a premium, strike, time to expiry, interest rate, and underlying price, you can back-solve for the IV that makes the Black-Scholes formula produce the observed premium. ATM IV is the most commonly used. The chart shows IV for Nifty 50 options updated in real time.
Why is NIFTY IV usually above HV?
IV carries a risk premium that HV does not. Option sellers demand compensation for taking on open-ended risk, and the market pays that compensation via inflated IV. For Nifty 50, this premium is typically 2-5 percentage points under normal conditions, rising during stress.
Can I trade purely on IV-HV signals on NIFTY?
Better to combine IV-HV with price action and other tools. Volatility-only strategies work but require experience. Most traders use IV-HV as a filter for other trade decisions — "this setup is high-conviction only if IV-HV agrees". This filtering approach fits more trading styles and reduces risk on Nifty 50.
Nifty 50 (NIFTY) IV-HV: Pro Tips
Tip 1: watch the rate of change on NIFTY
The rate at which the IV-HV spread changes is more meaningful than its absolute level. A slow-drifting spread reflects calm conditions. A rapidly expanding spread signals fresh stress. Rapid contraction signals IV crush or calming. These rates of change are actionable signals you can extract from the chart.
Tip 2: note persistent patterns on NIFTY
Some IV-HV patterns repeat on Nifty 50. Pre-budget widening is predictable each year. Earnings-season spikes for individual stocks are predictable. Recognising these recurring patterns builds your personal playbook and reduces surprises during live trading.
Tip 3: always size conservatively
Even the best IV-HV setups have losing trades. Conservative sizing ensures that a few losers do not destroy your account. Rule of thumb: no single trade should risk more than 2% of capital. Use this rule religiously regardless of how confident you feel about individual setups.
Tip 4: journal your observations as of 17 July 2026
Daily notes about the IV-HV chart build compound insight over time. After 60-90 days of consistent journaling, you have a personalised knowledge base for Nifty 50 volatility that no generic guide can match. As a major Broad Market index on NSE, volatility patterns are distinct enough to make this study worthwhile.
Nifty 50 (NIFTY) IV-HV: HV Calculation Windows
What window should I use for NIFTY HV?
HV can be calculated over different windows — 10 days, 20 days, 30 days, 90 days. Each gives a different picture of recent Nifty 50 volatility. Shorter windows are more responsive to recent changes; longer windows are smoother. The choice depends on your trading horizon. Day traders prefer shorter windows; swing and positional traders prefer longer ones.
10-day HV on NIFTY
10-day HV captures the most recent volatility conditions. It reacts quickly to changes in NIFTY price action. Useful for short-term trade decisions and spotting immediate volatility regime changes. The downside is it can be noisy — a few big days can skew the reading.
30-day HV on NIFTY
30-day HV is the standard reference for most volatility analysis. It balances responsiveness with stability. Most IV vs HV comparisons use 30-day HV because it represents a reasonable "recent past" that matches how traders typically think about recent market behaviour for Nifty 50.
Choosing the right window for your trades as of 17 July 2026
Match the HV window to your trade timeframe. If you hold positions for 1-3 days, use 10-day HV. For 1-2 week swing trades, use 20-30 day HV. For longer-term positions, use 90-day or more. The IV-HV chart should support different windows so you can pick the one that fits your style.
IV vs HV: Video Walkthrough
NIFTY IV-HV spread: quick reference
| IV minus HV (vol points) | Premium regime | Common reading |
|---|---|---|
| Below 0 | Volatility discount | Rare; options cheap vs realized moves — long straddles and backspreads favoured |
| 0 – 2 | Thin premium | Quiet regime on NIFTY; little edge for either side |
| 2 – 5 | Normal risk premium | Standard short-premium zone — strangles, iron condors, credit spreads |
| 5 – 10 | Event-inflated premium | Market pricing an event (results, RBI, budget); rich premium but real move risk |
| Above 10 | Extreme premium | Typical pre-earnings on stocks; expect IV crush once the event passes |
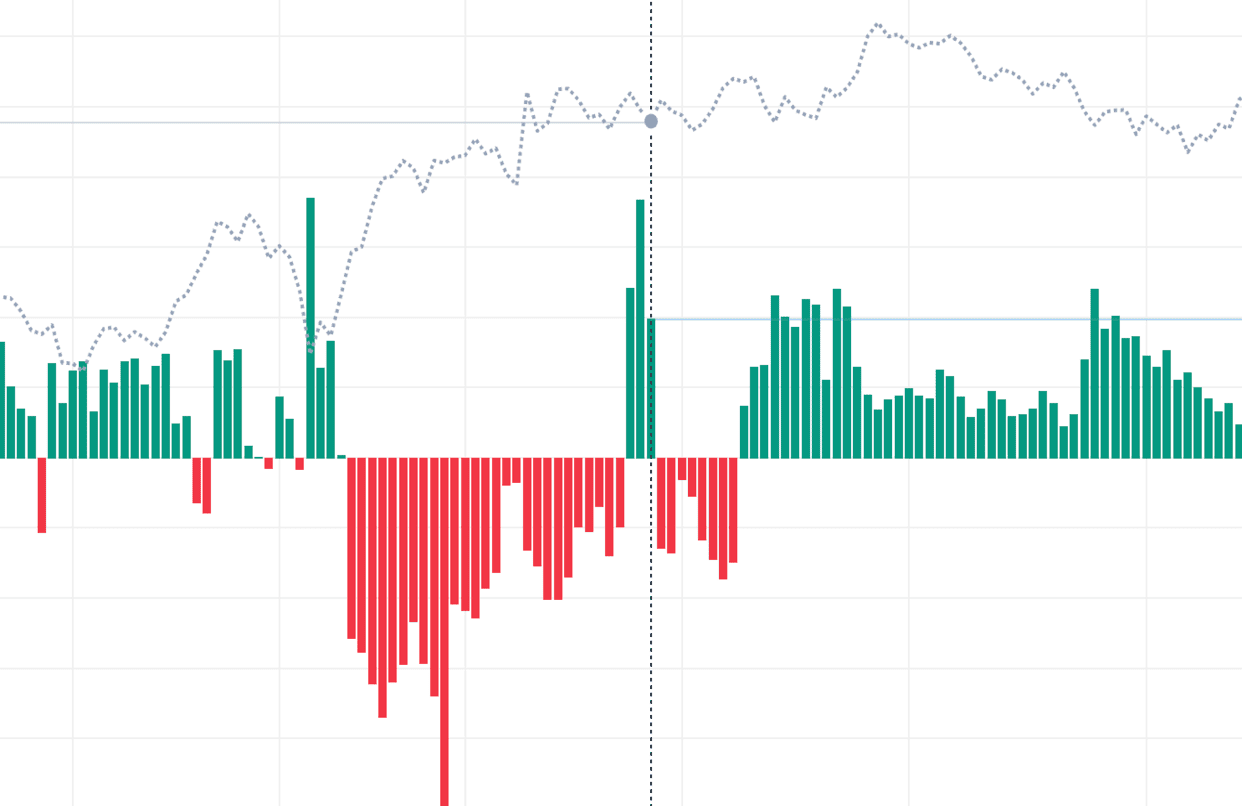
These bands are typical NSE tendencies, not fixed rules — indices usually hold a smaller IV-HV spread than single stocks, and spreads widen ahead of scheduled events. The live NIFTY chart above plots IV minus HV each session, so you can see which regime the option market is pricing right now and how today compares with recent history.
How to use the IV vs HV chart
- Pick an underlying — Select Nifty, BankNifty, or an F&O stock to compare implied versus historical volatility for.
- Compare the lines — IV is the forward-looking line; HV is the backward-looking line. Look at the current vertical gap between them.
- Evaluate the spread — A positive spread (IV > HV) favours premium-selling. A negative or near-zero spread favours premium-buying or long-volatility strategies.
- Check historical context — Scan how the spread has behaved over recent months. Is today's spread normal for this stock, or an outlier?
- Pick a strategy — Elevated IV-HV spread → short strangles, iron condors, credit spreads. Compressed IV-HV → long straddles, backspreads, debit spreads.
NIFTY IV vs HV — Frequently Asked Questions
What is NIFTY IV vs HV?
NIFTY IV (Implied Volatility) is the volatility priced into current option premiums — the market's forward expectation. HV (Historical Volatility) is the annualised standard deviation of actual past NIFTY returns over a chosen window. When IV is above HV, options are relatively expensive; when IV is below HV, option premium is cheap versus realized movement.
How to trade NIFTY using IV vs HV?
Use the NIFTY IV-HV spread as a strategy filter. When IV is well above HV, premium is rich — selling structures like short strangles and iron condors have favourable expected value. When IV drops to or below HV, premium is cheap — long straddles and backspreads become attractive. Always confirm with price action and upcoming events before entering.
Does NIFTY IV move before HV?
Yes. IV reacts the moment expectations change because it is derived from live NIFTY option prices, while HV only updates as new daily returns enter its rolling window, so it lags by several sessions. An IV spike ahead of an event is therefore a leading signal — by the time HV catches up, the move has usually already happened.
What is a normal IV-HV spread for NIFTY?
Most NSE underlyings, including NIFTY, trade with IV about 1-3 percentage points above HV — a normal volatility risk premium. A spread above 5 points usually signals event anticipation (results, budget, RBI policy) and tends to revert once the event passes. IV falling below HV is rare and marks unusually cheap option premium.
How often does the NIFTY IV vs HV chart update?
During NSE market hours (9:15 AM to 3:30 PM IST) the NIFTY IV line refreshes from the live option chain, while HV is recalculated from daily closing returns over your selected window (21 sessions by default). Outside market hours the chart shows the last traded session, and the historical series lets you study past spread behaviour.