ICICIBANK IV vs HV Chart | Volatility Premium & Discount Analysis
IV vs HV for ICICIBANK is the cleanest way to tell whether options on this underlying are cheap or expensive at any moment. Implied volatility (IV) is the volatility number baked into current ICICIBANK option prices — what the market expects going forward. Historical volatility (HV) is the actual standard deviation of past ICICIBANK returns over a chosen window — what the stock has actually done. The gap between the two tells you whether option buyers are over- or under-paying relative to recent reality.
When ICICIBANK IV is meaningfully above HV, the option market is pricing in more volatility than has actually been realized — premium is rich, and strategies like selling strangles, short straddles, and iron condors have favourable math. When IV drops below HV, option premium is cheap relative to the moves ICICIBANK has been making, and long-volatility strategies (long straddles, backspreads) get interesting. The ratio also reveals regime changes: a sustained IV-HV premium collapse often precedes breakouts, while expanding IV-HV premium usually marks complacency ahead of events.
Practical use of ICICIBANK IV-HV on NSE F&O
Most systematic option-selling strategies on ICICIBANK should filter entries by IV-HV gap — entering short-premium trades only when IV is sufficiently above HV compensates for the inherent tail risk. For event-day trades (budget, RBI, expiry), comparing current ICICIBANK IV with the HV you'd expect during the event window helps you decide whether the implied move is realistic, optimistic, or conservative — a crucial input for sizing and strike selection.
Combine IV vs HV with our IV Chart, Volatility Skew, and ATM Straddle Chart for a full ICICIBANK volatility analysis stack on NSE.
ICICI Bank Ltd (ICICIBANK) IV-HV: Stable Spread Environments
What is a stable spread environment on ICICIBANK?
A stable spread is when IV-HV stays within a narrow band for multiple sessions. For ICICI Bank Ltd, stability usually means the spread is between 2-6 points and does not deviate much day to day. These environments are typical of calm markets without imminent events. Trading during stable spreads requires different strategies than volatile environments.
Why stable spreads favour premium selling
In stable environments, IV and HV both move slowly. There are few surprises and mean reversion is reliable because nothing is pulling the spread far from its average. Short premium trades benefit from steady theta decay without vega surprises. Iron condors and short strangles work well in these conditions on ICICIBANK.
Why stable spreads are boring for long premium
Long premium needs volatility to expand to profit. In stable environments, IV rarely expands, so long positions suffer steady theta decay without offsetting gains. These are the worst environments for buying straddles or long options. Wait for spread changes before considering long premium strategies.
Watching for the end of stability on ICICIBANK as of 16 October 2026
Stable spreads eventually break. The first signs are: the spread starts moving off its recent range, HV starts rising (actual movement is increasing), or IV starts rising (expectations are changing). These early signals tell you to reduce short premium exposure and prepare for a different regime. Watching the IV-HV chart daily catches these transitions.
ICICI Bank Ltd (ICICIBANK) IV-HV Spread: The Volatility Premium
What is the volatility premium on ICICIBANK?
The volatility premium is the gap between IV and HV — IV minus HV. For index options like ICICI Bank Ltd, this premium is usually positive, meaning options are systematically priced above realised volatility. Market makers and option sellers collect this premium as compensation for taking on risk. It is one of the most persistent edges in options markets.
Why volatility premium exists on ICICIBANK
The premium exists because option sellers take unlimited risk in exchange for fixed premium. Buyers have defined risk but need direction and magnitude to profit. Sellers are compensated with a consistent edge — the premium that IV tends to exceed HV. Over long periods, this premium is a reliable source of income for disciplined sellers of ICICIBANK options.
Measuring the ICICIBANK premium
Check the chart daily. A healthy premium (IV about 2-5% above HV) is normal and makes short-premium strategies worthwhile. A huge premium (IV 10%+ above HV) is extreme — mean reversion is likely and short premium trades have higher expected value. A negative premium (IV below HV) is rare and usually means buying premium is attractive.
Capturing the premium as of 16 October 2026
For ICICI Bank Ltd, the best times to sell premium are when the IV-HV spread is above its recent average. Watch the chart for spread expansions and enter short premium trades then. The spread tends to mean-revert, which is exactly the movement that profits sellers.
ICICI Bank Ltd (ICICIBANK) IV-HV: Forecasting Premium Decay
Why IV-HV predicts premium decay on ICICIBANK
When IV is well above HV, options are overpriced relative to actual ICICI Bank Ltd movement. Over time, this premium tends to decay as IV moves down toward HV. The larger the initial gap, the more premium decay is expected. Forecasting this decay is one of the most reliable applications of the IV-HV chart.
Estimating the decay magnitude on ICICIBANK
As a rough rule, the expected decay is roughly the IV-HV spread minus a small "permanent premium" that the market normally carries. For ICICIBANK, if the spread is 8 percentage points and the normal premium is 3 points, the expected decay is about 5 points of IV contraction. This rough estimate guides position sizing and profit expectations.
Timing premium decay trades
Decay happens most reliably after event-driven spikes and during calm-market regime transitions. During persistent volatility, decay stalls. Check the IV-HV chart regularly to identify when decay is actively happening (spread compressing) versus when it is stalled (spread stable or widening). Only enter when decay is actively underway.
Trade management around decay on ICICIBANK as of 16 October 2026
For premium sellers, exit trades when most of the expected decay has happened — usually 50-70% of maximum profit. Holding for the full 100% exposes you to unnecessary risk. For premium buyers, exit as soon as IV expansion has happened meaningfully. Both sides benefit from not being greedy.
IV vs HV: Video Walkthrough
ICICIBANK IV-HV spread: quick reference
| IV minus HV (vol points) | Premium regime | Common reading |
|---|---|---|
| Below 0 | Volatility discount | Rare; options cheap vs realized moves — long straddles and backspreads favoured |
| 0 – 2 | Thin premium | Quiet regime on ICICIBANK; little edge for either side |
| 2 – 5 | Normal risk premium | Standard short-premium zone — strangles, iron condors, credit spreads |
| 5 – 10 | Event-inflated premium | Market pricing an event (results, RBI, budget); rich premium but real move risk |
| Above 10 | Extreme premium | Typical pre-earnings on stocks; expect IV crush once the event passes |
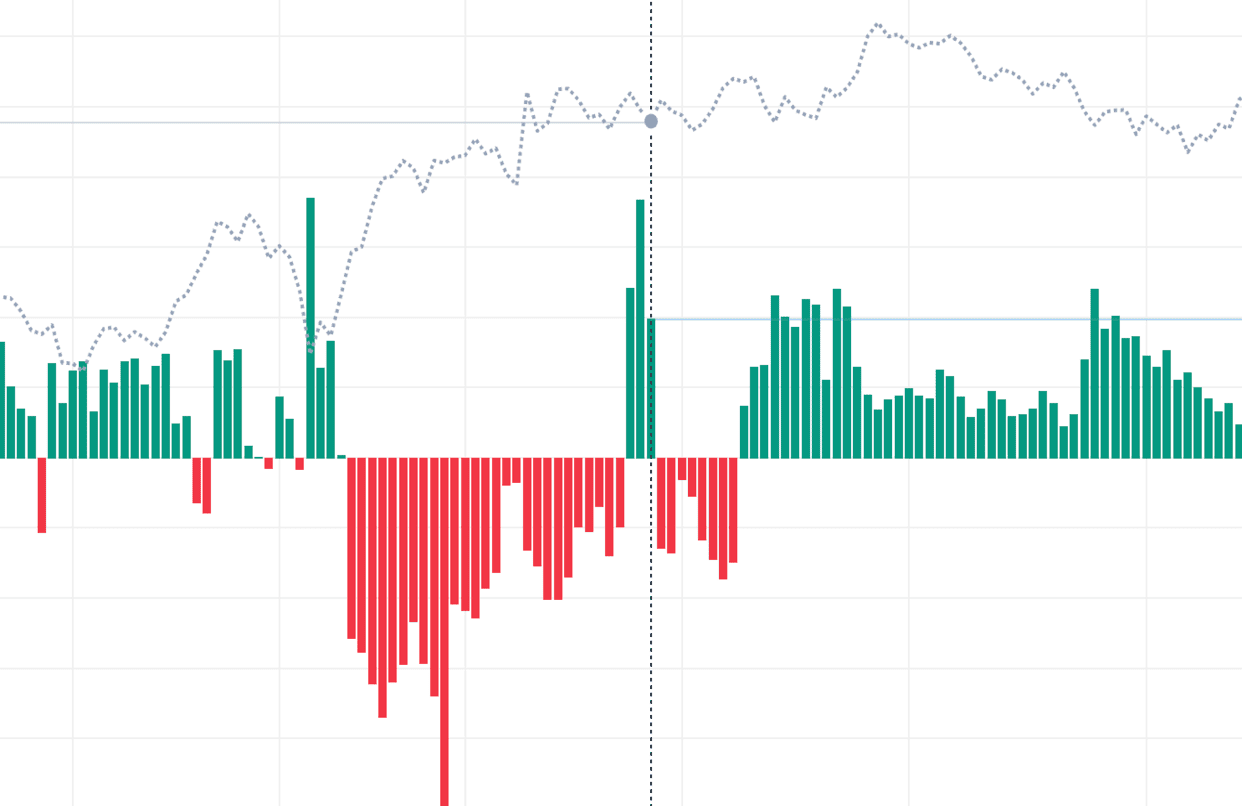
These bands are typical NSE tendencies, not fixed rules — indices usually hold a smaller IV-HV spread than single stocks, and spreads widen ahead of scheduled events. The live ICICIBANK chart above plots IV minus HV each session, so you can see which regime the option market is pricing right now and how today compares with recent history.
How to use the IV vs HV chart
- Pick an underlying — Select Nifty, BankNifty, or an F&O stock to compare implied versus historical volatility for.
- Compare the lines — IV is the forward-looking line; HV is the backward-looking line. Look at the current vertical gap between them.
- Evaluate the spread — A positive spread (IV > HV) favours premium-selling. A negative or near-zero spread favours premium-buying or long-volatility strategies.
- Check historical context — Scan how the spread has behaved over recent months. Is today's spread normal for this stock, or an outlier?
- Pick a strategy — Elevated IV-HV spread → short strangles, iron condors, credit spreads. Compressed IV-HV → long straddles, backspreads, debit spreads.
ICICIBANK IV vs HV — Frequently Asked Questions
What is ICICIBANK IV vs HV?
ICICIBANK IV (Implied Volatility) is the volatility priced into current option premiums — the market's forward expectation. HV (Historical Volatility) is the annualised standard deviation of actual past ICICIBANK returns over a chosen window. When IV is above HV, options are relatively expensive; when IV is below HV, option premium is cheap versus realized movement.
How to trade ICICIBANK using IV vs HV?
Use the ICICIBANK IV-HV spread as a strategy filter. When IV is well above HV, premium is rich — selling structures like short strangles and iron condors have favourable expected value. When IV drops to or below HV, premium is cheap — long straddles and backspreads become attractive. Always confirm with price action and upcoming events before entering.
Does ICICIBANK IV move before HV?
Yes. IV reacts the moment expectations change because it is derived from live ICICIBANK option prices, while HV only updates as new daily returns enter its rolling window, so it lags by several sessions. An IV spike ahead of an event is therefore a leading signal — by the time HV catches up, the move has usually already happened.
What is a normal IV-HV spread for ICICIBANK?
Most NSE underlyings, including ICICIBANK, trade with IV about 1-3 percentage points above HV — a normal volatility risk premium. A spread above 5 points usually signals event anticipation (results, budget, RBI policy) and tends to revert once the event passes. IV falling below HV is rare and marks unusually cheap option premium.
How often does the ICICIBANK IV vs HV chart update?
During NSE market hours (9:15 AM to 3:40 PM IST) the ICICIBANK IV line refreshes from the live option chain, while HV is recalculated from daily closing returns over your selected window (21 sessions by default). Outside market hours the chart shows the last traded session, and the historical series lets you study past spread behaviour.
Learn more
Read our guide: Implied Volatility (IV) Explained for Indian F&O Traders