ICICIBANK Implied Volatility (IV) Chart today | Live NSE Data
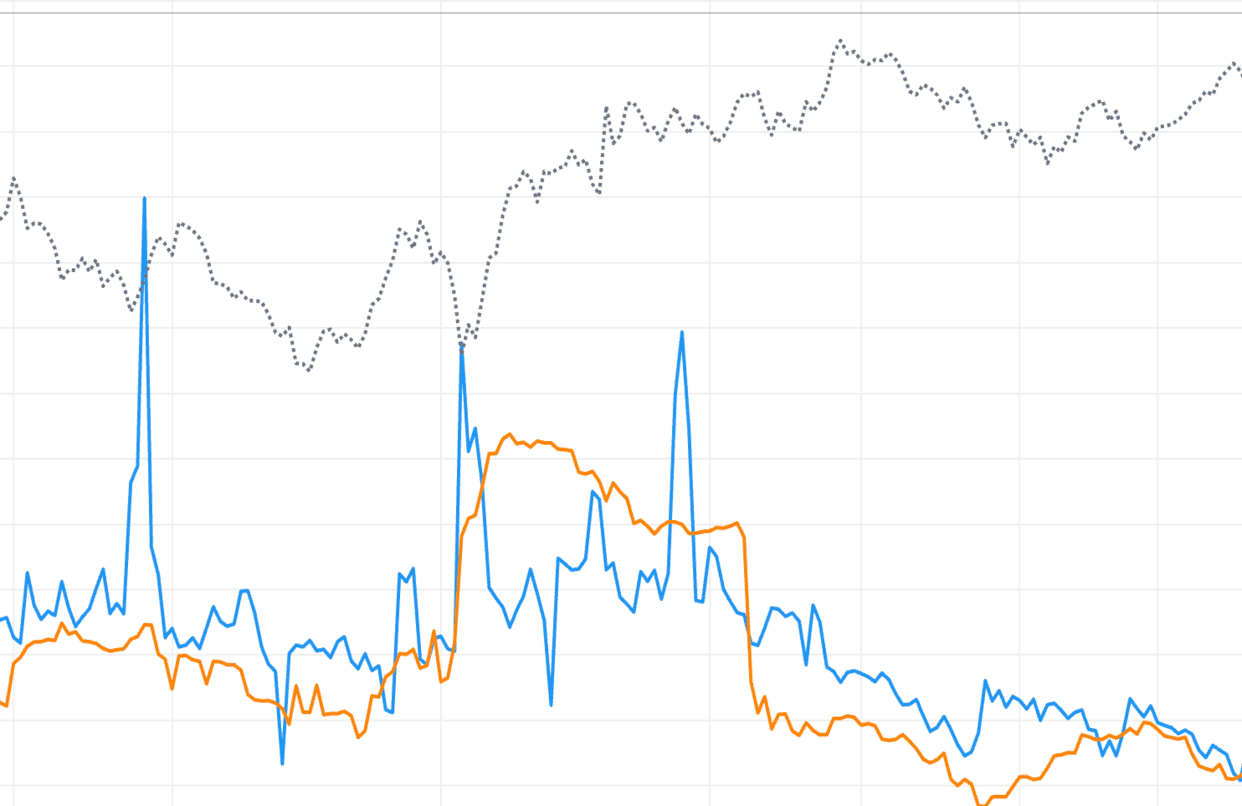
Track real-time and historical ICICIBANK Implied Volatility (IV) with StockMojo's advanced charting tool. Implied volatility is a critical metric for options traders, representing the market's expectation of future price movement and determining the premium price of option contracts.
Use our live ICICIBANK IV chart to identify whether options are overvalued or undervalued. Analyze IV percentile and IV rank to compare current volatility levels against historical data, helping you choose the right options strategy—whether it's buying options during low IV periods or selling premiums when IV is elevated. Our intraday IV tracking helps you spot volatility spikes and crushes around major market events and earnings announcements.
Enhance your volatility analysis with our IV Grid Screener,Volatility Skew, and Open Interest tools.
ICICI Bank Ltd (ICICIBANK) IV Chart: Intraday Patterns
Does ICICIBANK IV change intraday?
Yes. ICICI Bank Ltd IV moves throughout the trading session based on actual price behaviour, order flow, and news. Morning IV often differs from afternoon IV. The IV chart shows these intraday changes in live mode. For active traders, these changes are meaningful — they represent opportunities or warnings depending on direction.
Morning IV patterns on ICICIBANK
IV often starts elevated at the open because overnight positioning and uncertainty carry over. In quiet sessions, IV typically drifts lower through the first hour as the market settles into its range. On volatile mornings, IV may rise further. Watching the first-hour pattern tells you what kind of day to expect.
Mid-day IV patterns on ICICIBANK
From about 11 AM to 1:30 PM, ICICIBANK IV is usually at its calmest. Order flow is lighter, institutional activity is lower, and time decay is the dominant force. This quiet window is often good for observation and planning rather than active trading.
Final-hour IV patterns on ICICIBANK as of 13 October 2026
The last hour (2:30-3:30 PM) can see sharp IV moves as institutions position for the next session. Watch for sudden spikes or drops. These often signal overnight expectations and are predictive for the following day. For ICICI Bank Ltd, the closing IV trend is one of the most useful end-of-day data points.
ICICI Bank Ltd (ICICIBANK) IV Chart: High IV vs Low IV Environments
What is a high IV environment for ICICIBANK?
High IV means ICICI Bank Ltd options are expensive — their premiums include a large uncertainty component. High IV environments typically appear before major events, during market crises, and after sharp price moves. On the chart, high IV shows as the line sitting in the top quarter of its recent range. For ICICIBANK, these environments favour premium-selling strategies.
Strategies for high ICICIBANK IV
When ICICIBANK IV is elevated, consider: selling strangles (collect inflated premium), iron condors (defined risk version), credit spreads (directional with premium collection), and avoiding long calls or puts (you are paying too much). The key insight: high IV will likely mean-revert back to normal, and that mean-reversion is the source of profit for sellers.
What is a low IV environment for ICICIBANK?
Low IV means ICICI Bank Ltd options are cheap. This typically appears during calm market periods, after volatility has compressed, and when no events are pending. On the chart, low IV shows as the line sitting in the bottom quarter of its recent range. For ICICIBANK, low IV environments favour premium-buying strategies.
Strategies for low ICICIBANK IV as of 13 October 2026
When IV is depressed, consider: long calls (cheap bullish bets), long puts (cheap bearish bets), long straddles (direction-neutral volatility bets), and debit spreads (defined cost). The insight: low IV will likely expand eventually, and that expansion benefits buyers. Check the IV chart before every trade to classify today's environment.
ICICI Bank Ltd (ICICIBANK) IV Chart: Volatility Skew Relationship
What is the link between ICICIBANK IV and skew?
Overall IV tells you how volatile the market expects ICICI Bank Ltd to be. Skew tells you whether that expectation is symmetric or lopsided. High IV with steep put skew means the market fears a crash more than a rally — downside risk is priced in. High IV with flat skew means broad uncertainty without a directional bias. Reading both together gives richer insight.
Fear environments on ICICIBANK
In fear environments, both overall IV and put skew rise together. The options market is pricing in both more movement and more downside-specific risk. This typically happens during selloffs, pre-event stress, or global market disturbances. Trading strategies should respect the bearish bias — reduce long exposure, buy protection, or stay defensive.
Complacency environments on ICICIBANK
In complacency environments, IV is low and skew is flat. The market sees little risk from either direction. These environments often precede volatility spikes because complacency can be broken by any unexpected news. Buying protection while it is cheap is a smart move when you see this pattern.
Using IV and skew together on ICICIBANK as of 13 October 2026
Before entering any options position, check both overall IV (is premium cheap or expensive?) and skew (is one side pricier than the other?). These two dimensions cover most of what you need to know about ICICI Bank Ltd option pricing. Skip positions where both readings warn against your trade.
IV Chart: Video Walkthrough
ICICIBANK IV Rank & IV Percentile: quick reference
| IVR / IVP band | Premium regime | Common strategy bias |
|---|---|---|
| Below 20% | Very cheap options | Buy premium — long straddles, strangles, debit spreads |
| 20% – 40% | Below-average IV | Lean buyer; prefer debit spreads over selling thin premium |
| 40% – 60% | Fair-value zone | No volatility edge; trade ICICIBANK direction, not vol |
| 60% – 80% | Elevated premium | Sell premium — credit spreads, iron condors |
| Above 80% | Extreme / event-driven IV | Rich premium, but check the event calendar before selling |
These bands are conventions used by NSE premium sellers, not fixed rules — ahead of a scheduled event a high IVR reading is normal and can persist until the event resolves. The live ICICIBANK chart above plots IVR and IVP against your chosen lookback, so you can see in real time which regime current option pricing sits in.
How to use the StockMojo IV Chart
- Select an underlying — Choose Nifty, BankNifty, or any F&O stock from the symbol selector.
- Read the current IV reading — The chart shows IV plotted over time. Note the latest value and where it sits relative to the visible range.
- Check IV Rank and IV Percentile — Look at the IV Rank and IV Percentile metrics displayed beside the chart. Values above 50% suggest elevated IV; below 50% suggest depressed IV.
- Compare IV vs HV — Toggle the historical volatility overlay. A wide gap (IV well above HV) signals overpriced options; a narrow or inverted gap signals underpriced options.
- Pick your strategy bias — Use the IV regime to bias toward premium selling (high IV) or premium buying (low IV) before entering a trade.
ICICIBANK IV Chart — Frequently Asked Questions
What is ICICIBANK implied volatility (IV)?
ICICIBANK implied volatility (IV) is the market's forward-looking estimate of how much ICICIBANK will move, derived by solving an option pricing model backwards from live NSE option premiums. High IV means options are expensive and a big move is priced in; low IV means options are cheap. IV measures expected magnitude of movement, not direction.
What is a good IV Rank (IVR) for selling ICICIBANK options?
An IV Rank above 50% is the common filter for selling ICICIBANK premium, and above 75% is a strong sell-side setup. IVR scales current IV between its 52-week low (0%) and high (100%), so a high reading means options are rich versus the past year. Below 25%, premium is cheap and buying strategies are favoured instead.
What is the difference between IV, HV and RV on the ICICIBANK chart?
IV is the forward-looking volatility implied by current ICICIBANK option prices, HV (historical volatility) measures actual movement over a past window, and RV (realised volatility) tracks what price is doing right now. When IV trades well above HV, ICICIBANK options are overpriced relative to real movement — an edge for premium sellers; a narrow or inverted gap favours buyers.
What causes an IV crush in ICICIBANK options?
IV crush is the rapid collapse of implied volatility once a scheduled event resolves the uncertainty that was inflating it. For ICICIBANK, common triggers are RBI policy meetings, the Union Budget, election results, quarterly earnings and major global data. Premiums deflate within minutes even when the direction was right, so option buyers avoid entering at pre-event IV peaks.
How often does the ICICIBANK IV chart update?
During NSE market hours (9:15 AM to 3:40 PM IST) the ICICIBANK IV chart refreshes every minute, recomputing IV from live option premiums alongside HV, RV and the futures price. IVP and IVR are recalculated against your selected lookback (default 252 sessions). Outside market hours the chart shows the last traded session's readings.
Learn more
Read our guide: IV Rank vs IV Percentile: Which Should Option Sellers Use?