BANKNIFTY Implied Volatility (IV) Chart today | Live NSE Data
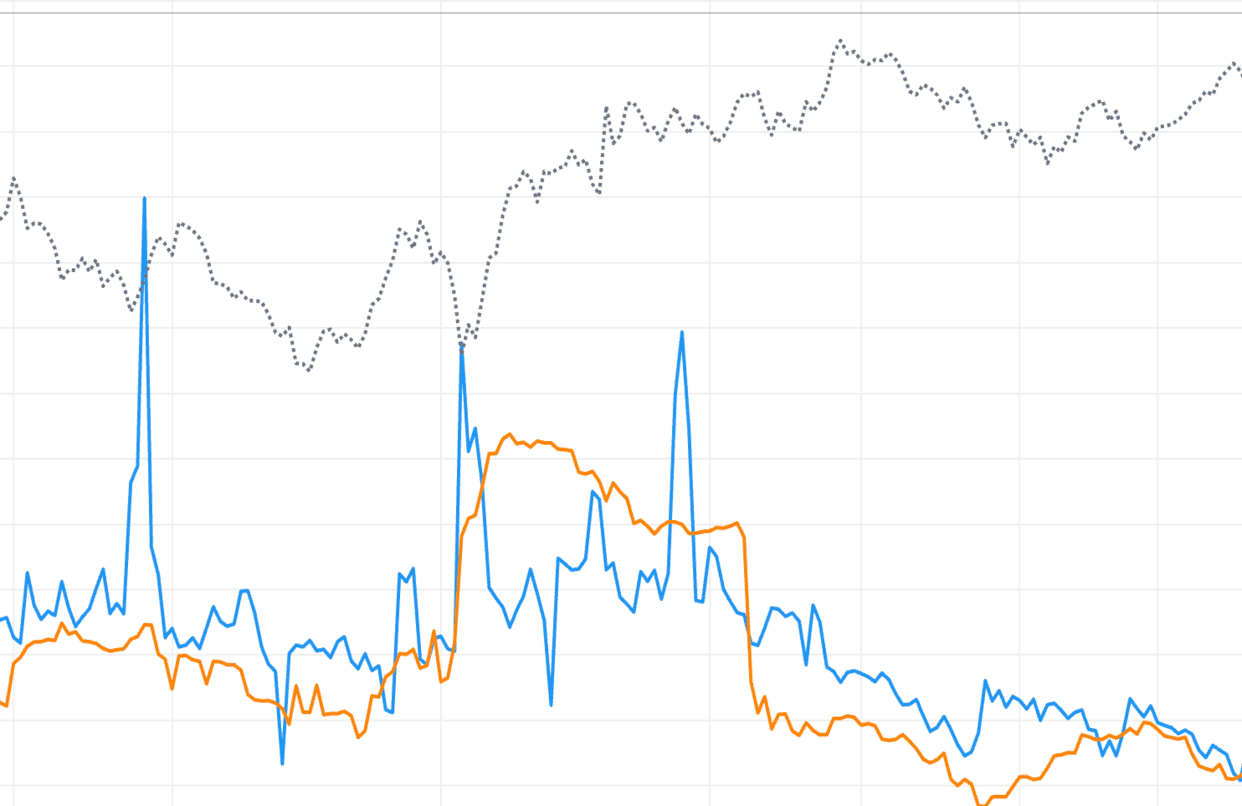
Track real-time and historical BANKNIFTY Implied Volatility (IV) with StockMojo's advanced charting tool. Implied volatility is a critical metric for options traders, representing the market's expectation of future price movement and determining the premium price of option contracts.
Use our live BANKNIFTY IV chart to identify whether options are overvalued or undervalued. Analyze IV percentile and IV rank to compare current volatility levels against historical data, helping you choose the right options strategy—whether it's buying options during low IV periods or selling premiums when IV is elevated. Our intraday IV tracking helps you spot volatility spikes and crushes around major market events and earnings announcements.
Enhance your volatility analysis with our IV Grid Screener,Volatility Skew, and Open Interest tools.
Bank Nifty (BANKNIFTY) IV Chart: Reading the Trend
Why IV trend matters more than level
A static IV reading is a snapshot. The trend is the story. A Bank Nifty IV of 20% that has been rising for 5 days tells a different story than 20% that has been falling for 5 days. Rising means fear is building; falling means fear is easing. The chart's directional line is usually more actionable than the absolute value.
Spotting BANKNIFTY IV uptrends
An IV uptrend on the chart means each session's IV is higher than the previous. Uptrends usually happen around events, during selloffs, or when global fear is rising. Long-premium strategies work during uptrends — the rising IV lifts your long options independently of direction. Short-premium strategies struggle because rising IV works against you.
Spotting BANKNIFTY IV downtrends
A downtrend means each session's IV is lower than the previous. Downtrends happen after events have resolved, during calm rallies, or when fear is fading. Short-premium strategies benefit from downtrends — your short options collect faster time decay plus the benefit of falling IV. Long-premium strategies suffer for the opposite reason.
Using BANKNIFTY IV trends as of 13 October 2026
Before every trade, glance at the IV chart's 5-10 day trend. Is it rising, falling, or flat? Match your strategy to the trend. Going long in a rising IV environment or short in a falling one has the wind at your back. Fighting the IV trend has the wind in your face. This simple alignment meaningfully improves your hit rate on Bank Nifty trades.
Bank Nifty (BANKNIFTY) IV Chart: Advanced Reading
Reading BANKNIFTY IV curvature
Advanced users do not just look at IV levels — they look at how IV changes through time. A smoothly declining IV curve is normal in calm markets. Sharp upticks signal fresh fear. Plateaus at high levels signal sustained concern. Each curvature shape has trading implications for Bank Nifty.
Spotting IV regime changes early
Regime changes usually happen gradually on BANKNIFTY. A 5-session persistent trend in IV (rising or falling) often marks the start of a new regime. Catching these transitions early gives you a significant edge over traders who only react once the new regime is obvious. The IV chart makes early detection possible if you check it daily.
Using BANKNIFTY IV for position adjustments
For existing positions, changing IV affects your P&L through vega. Rising IV helps longs and hurts shorts. Falling IV does the opposite. By monitoring the IV chart, you know whether to tighten stops, add to positions, or take profits based on how vega is affecting your book.
Pro-level BANKNIFTY IV analysis as of 13 October 2026
The highest-level trade decisions combine IV context, skew context, OI positioning, price action, and the broader market environment. Each input informs the others. IV is one of several pillars, not the whole story. But it is an essential pillar — traders who ignore IV operate at a permanent disadvantage on Bank Nifty.
Bank Nifty (BANKNIFTY) IV Chart: The Link Between IV and Price
Are BANKNIFTY IV and price related?
IV and price are related but not directly. Bank Nifty IV tends to rise when price drops sharply (fear pushes up put buying) and fall when price rises steadily (calm reduces uncertainty). This inverse relationship is especially strong for index options. Watching both the price chart and the IV chart together gives you a fuller view of what is happening.
Rising IV with falling BANKNIFTY price
This is the classic "fear" pattern. BANKNIFTY is dropping, protective put buying is spiking, and IV is rising to reflect the increased demand. The chart shows this as price going down while IV goes up. It is a valid signal that fear is building. If the move continues without any IV relief, further downside is possible. If IV peaks while price is still falling, a bottom may be near.
Falling IV with rising BANKNIFTY price
The opposite pattern. Bank Nifty is rising steadily, fear is fading, and IV is contracting. This is usually a bullish continuation signal — the market is calm and willing to stay long. Short premium strategies work well in this environment because the falling IV speeds up profits from written options.
Divergences between BANKNIFTY IV and price as of 13 October 2026
When IV and price disagree, reversal signals appear. Rising IV with rising price is unusual — it suggests the rally is being doubted by some. Falling IV with falling price means the decline is being absorbed calmly — possibly bottoming. Divergences are worth investigating because they often precede reversals.
IV Chart: Video Walkthrough
BANKNIFTY IV Rank & IV Percentile: quick reference
| IVR / IVP band | Premium regime | Common strategy bias |
|---|---|---|
| Below 20% | Very cheap options | Buy premium — long straddles, strangles, debit spreads |
| 20% – 40% | Below-average IV | Lean buyer; prefer debit spreads over selling thin premium |
| 40% – 60% | Fair-value zone | No volatility edge; trade BANKNIFTY direction, not vol |
| 60% – 80% | Elevated premium | Sell premium — credit spreads, iron condors |
| Above 80% | Extreme / event-driven IV | Rich premium, but check the event calendar before selling |
These bands are conventions used by NSE premium sellers, not fixed rules — ahead of a scheduled event a high IVR reading is normal and can persist until the event resolves. The live BANKNIFTY chart above plots IVR and IVP against your chosen lookback, so you can see in real time which regime current option pricing sits in.
How to use the StockMojo IV Chart
- Select an underlying — Choose Nifty, BankNifty, or any F&O stock from the symbol selector.
- Read the current IV reading — The chart shows IV plotted over time. Note the latest value and where it sits relative to the visible range.
- Check IV Rank and IV Percentile — Look at the IV Rank and IV Percentile metrics displayed beside the chart. Values above 50% suggest elevated IV; below 50% suggest depressed IV.
- Compare IV vs HV — Toggle the historical volatility overlay. A wide gap (IV well above HV) signals overpriced options; a narrow or inverted gap signals underpriced options.
- Pick your strategy bias — Use the IV regime to bias toward premium selling (high IV) or premium buying (low IV) before entering a trade.
BANKNIFTY IV Chart — Frequently Asked Questions
What is BANKNIFTY implied volatility (IV)?
BANKNIFTY implied volatility (IV) is the market's forward-looking estimate of how much BANKNIFTY will move, derived by solving an option pricing model backwards from live NSE option premiums. High IV means options are expensive and a big move is priced in; low IV means options are cheap. IV measures expected magnitude of movement, not direction.
What is a good IV Rank (IVR) for selling BANKNIFTY options?
An IV Rank above 50% is the common filter for selling BANKNIFTY premium, and above 75% is a strong sell-side setup. IVR scales current IV between its 52-week low (0%) and high (100%), so a high reading means options are rich versus the past year. Below 25%, premium is cheap and buying strategies are favoured instead.
What is the difference between IV, HV and RV on the BANKNIFTY chart?
IV is the forward-looking volatility implied by current BANKNIFTY option prices, HV (historical volatility) measures actual movement over a past window, and RV (realised volatility) tracks what price is doing right now. When IV trades well above HV, BANKNIFTY options are overpriced relative to real movement — an edge for premium sellers; a narrow or inverted gap favours buyers.
What causes an IV crush in BANKNIFTY options?
IV crush is the rapid collapse of implied volatility once a scheduled event resolves the uncertainty that was inflating it. For BANKNIFTY, common triggers are RBI policy meetings, the Union Budget, election results, quarterly earnings and major global data. Premiums deflate within minutes even when the direction was right, so option buyers avoid entering at pre-event IV peaks.
How often does the BANKNIFTY IV chart update?
During NSE market hours (9:15 AM to 3:40 PM IST) the BANKNIFTY IV chart refreshes every minute, recomputing IV from live option premiums alongside HV, RV and the futures price. IVP and IVR are recalculated against your selected lookback (default 252 sessions). Outside market hours the chart shows the last traded session's readings.
Learn more
Read our guide: IV Rank vs IV Percentile: Which Should Option Sellers Use?