RELIANCE Implied Volatility (IV) Chart today | Live NSE Data
Track real-time and historical RELIANCE Implied Volatility (IV) with StockMojo's advanced charting tool. Implied volatility is a critical metric for options traders, representing the market's expectation of future price movement and determining the premium price of option contracts.
Use our live RELIANCE IV chart to identify whether options are overvalued or undervalued. Analyze IV percentile and IV rank to compare current volatility levels against historical data, helping you choose the right options strategy—whether it's buying options during low IV periods or selling premiums when IV is elevated. Our intraday IV tracking helps you spot volatility spikes and crushes around major market events and earnings announcements.
Enhance your volatility analysis with our IV Grid Screener,Volatility Skew, and Open Interest tools.
Reliance Industries Ltd (RELIANCE) IV Chart: What Implied Volatility Tells You
What is implied volatility for RELIANCE?
Implied Volatility (IV) is the market's forecast for how much Reliance Industries Ltd (RELIANCE) will move in the future, derived from current option premiums. It is not a prediction of direction — only magnitude. When the market expects big moves, IV is high and options are expensive. When the market expects calm, IV is low and options are cheap. The RELIANCE IV chart plots this value over time so you can see the changes.
Why watch the RELIANCE IV chart?
Options pricing has two main drivers — direction and volatility. You can be right on direction but still lose money if you buy when IV is high and it subsequently crashes. Knowing where IV sits on the chart helps you avoid these expensive entries and identify cheap entries. For Reliance Industries Ltd, IV changes dramatically around events, so watching the chart is essential for timing.
What drives RELIANCE IV changes?
Three main drivers: upcoming events (policy meetings, earnings, data releases), recent realised volatility (sharp moves tend to raise IV), and overall market conditions. As a NIFTY constituent, global market conditions also influence RELIANCE IV significantly. The chart shows the cumulative effect of all these factors as a single line you can track daily.
Getting started with RELIANCE IV today
As of 13 October 2026, open the IV chart and compare today's level to the past 30 days. Is current IV near the high or low of the range? High means selling premium is attractive; low means buying premium is attractive. This quick check takes 10 seconds and guides your strategy selection for Reliance Industries Ltd.
Reliance Industries Ltd (RELIANCE) IV Chart: Multiple Timeframe Analysis
Short-term RELIANCE IV view
On a short-term view (1-5 sessions), Reliance Industries Ltd IV moves due to day-to-day sentiment and immediate event hedging. Short-term extremes are common and mean-revert quickly. Traders using short-term views should watch for rapid spikes and drops within this window. Day traders and scalpers operate almost exclusively at this timeframe.
Medium-term RELIANCE IV view
Medium-term (10-30 sessions) reflects broader market conditions and positioning cycles. Swing traders operate in this window. Medium-term IV patterns tend to be smoother and more reliable than short-term. A medium-term IV expansion or compression often signals a meaningful trend change.
Long-term RELIANCE IV view
Long-term (3-6 months or more) reflects macro regime conditions. In bull markets, IV tends to compress over time. In bear markets or uncertain conditions, IV tends to expand. Long-term traders should watch this view to understand the broader volatility regime RELIANCE is operating in.
Combining all three for RELIANCE as of 13 October 2026
The best trade decisions come from consistency across timeframes. If IV is low across short, medium, and long views, premium is cheap across the board — strong buy signal. If it is high across all three, premium is expensive — strong sell signal. Mixed signals warrant caution. Use the IV chart to check all three timeframes before every trade.
Reliance Industries Ltd (RELIANCE) IV Chart: Vega Exposure and Risk
What is vega for RELIANCE options?
Vega is the sensitivity of an option's premium to changes in IV. Options with high vega gain or lose more when IV changes. ATM options have the highest vega. Deep OTM and deep ITM options have lower vega. For Reliance Industries Ltd positions, vega is often as important as delta because IV changes can be as large as price moves over short periods.
Long vega positions on RELIANCE
Long options are long vega — they benefit from rising IV. If you buy RELIANCE options when IV is low and IV later expands, vega provides profit independent of direction. This is why buying cheap volatility before expected IV expansion is such a powerful trade. The IV chart identifies these opportunities.
Short vega positions on RELIANCE
Short options are short vega — they benefit from falling IV. Selling options when IV is high captures the subsequent contraction. This is the classic premium-selling edge when done at the right time. The IV chart helps identify the right time — when IV is at the high end of its range and likely to mean-revert.
Managing vega on RELIANCE as of 13 October 2026
Know the net vega of your Reliance Industries Ltd portfolio. Long net vega = you profit if IV rises. Short net vega = you profit if IV falls. Mismatched vega exposure is a hidden risk many traders ignore. The IV chart helps you make informed vega decisions rather than accidental ones.
IV Chart: Video Walkthrough
RELIANCE IV Rank & IV Percentile: quick reference
| IVR / IVP band | Premium regime | Common strategy bias |
|---|---|---|
| Below 20% | Very cheap options | Buy premium — long straddles, strangles, debit spreads |
| 20% – 40% | Below-average IV | Lean buyer; prefer debit spreads over selling thin premium |
| 40% – 60% | Fair-value zone | No volatility edge; trade RELIANCE direction, not vol |
| 60% – 80% | Elevated premium | Sell premium — credit spreads, iron condors |
| Above 80% | Extreme / event-driven IV | Rich premium, but check the event calendar before selling |
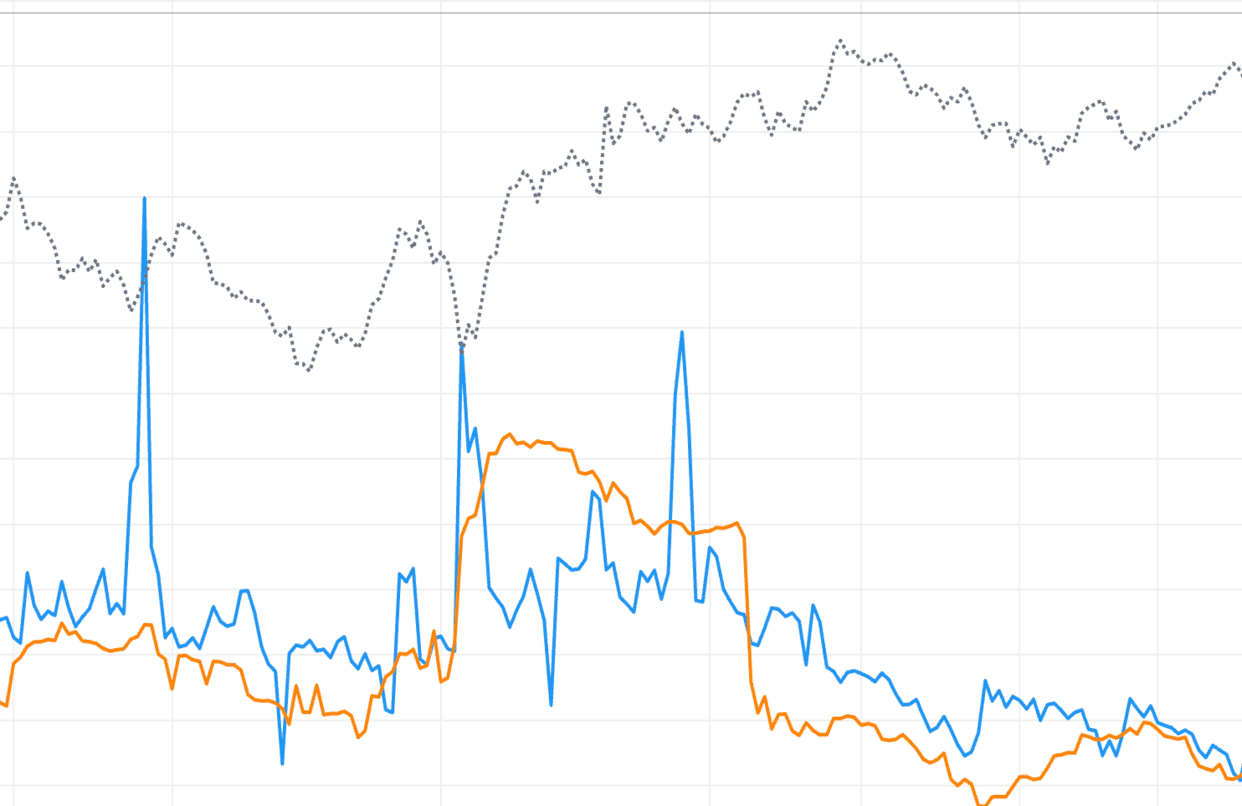
These bands are conventions used by NSE premium sellers, not fixed rules — ahead of a scheduled event a high IVR reading is normal and can persist until the event resolves. The live RELIANCE chart above plots IVR and IVP against your chosen lookback, so you can see in real time which regime current option pricing sits in.
How to use the StockMojo IV Chart
- Select an underlying — Choose Nifty, BankNifty, or any F&O stock from the symbol selector.
- Read the current IV reading — The chart shows IV plotted over time. Note the latest value and where it sits relative to the visible range.
- Check IV Rank and IV Percentile — Look at the IV Rank and IV Percentile metrics displayed beside the chart. Values above 50% suggest elevated IV; below 50% suggest depressed IV.
- Compare IV vs HV — Toggle the historical volatility overlay. A wide gap (IV well above HV) signals overpriced options; a narrow or inverted gap signals underpriced options.
- Pick your strategy bias — Use the IV regime to bias toward premium selling (high IV) or premium buying (low IV) before entering a trade.
RELIANCE IV Chart — Frequently Asked Questions
What is RELIANCE implied volatility (IV)?
RELIANCE implied volatility (IV) is the market's forward-looking estimate of how much RELIANCE will move, derived by solving an option pricing model backwards from live NSE option premiums. High IV means options are expensive and a big move is priced in; low IV means options are cheap. IV measures expected magnitude of movement, not direction.
What is a good IV Rank (IVR) for selling RELIANCE options?
An IV Rank above 50% is the common filter for selling RELIANCE premium, and above 75% is a strong sell-side setup. IVR scales current IV between its 52-week low (0%) and high (100%), so a high reading means options are rich versus the past year. Below 25%, premium is cheap and buying strategies are favoured instead.
What is the difference between IV, HV and RV on the RELIANCE chart?
IV is the forward-looking volatility implied by current RELIANCE option prices, HV (historical volatility) measures actual movement over a past window, and RV (realised volatility) tracks what price is doing right now. When IV trades well above HV, RELIANCE options are overpriced relative to real movement — an edge for premium sellers; a narrow or inverted gap favours buyers.
What causes an IV crush in RELIANCE options?
IV crush is the rapid collapse of implied volatility once a scheduled event resolves the uncertainty that was inflating it. For RELIANCE, common triggers are RBI policy meetings, the Union Budget, election results, quarterly earnings and major global data. Premiums deflate within minutes even when the direction was right, so option buyers avoid entering at pre-event IV peaks.
How often does the RELIANCE IV chart update?
During NSE market hours (9:15 AM to 3:40 PM IST) the RELIANCE IV chart refreshes every minute, recomputing IV from live option premiums alongside HV, RV and the futures price. IVP and IVR are recalculated against your selected lookback (default 252 sessions). Outside market hours the chart shows the last traded session's readings.
Learn more
Read our guide: IV Rank vs IV Percentile: Which Should Option Sellers Use?