FINNIFTY Implied Volatility (IV) Chart today | Live NSE Data
Track real-time and historical FINNIFTY Implied Volatility (IV) with StockMojo's advanced charting tool. Implied volatility is a critical metric for options traders, representing the market's expectation of future price movement and determining the premium price of option contracts.
Use our live FINNIFTY IV chart to identify whether options are overvalued or undervalued. Analyze IV percentile and IV rank to compare current volatility levels against historical data, helping you choose the right options strategy—whether it's buying options during low IV periods or selling premiums when IV is elevated. Our intraday IV tracking helps you spot volatility spikes and crushes around major market events and earnings announcements.
Enhance your volatility analysis with our IV Grid Screener,Volatility Skew, and Open Interest tools.
Nifty Financial Services (FINNIFTY) IV Chart: Historical Comparison Strategies
Why compare to past FINNIFTY data
Today's IV is most meaningful when compared to past values. A reading of 18% means little in isolation. A reading of 18% that is well above a 3-month average of 14% is elevated. The same 18% that is well below a 3-month average of 24% is depressed. Historical comparison turns raw numbers into actionable signals for Nifty Financial Services.
Useful past periods for FINNIFTY
Compare current IV to: the past 30 days (short-term context), the past 90 days (medium-term context), the past 1 year (long-term context), and the same period in prior years (seasonal context). Each comparison window tells a different story. The more contexts you have, the better your interpretation.
Seasonal FINNIFTY IV patterns
Nifty Financial Services IV often has seasonal patterns. Budget season brings elevated IV. Monsoon and earnings months can produce compression or expansion depending on results. End of financial year sees unique positioning. Recognising seasonal patterns helps you predict IV changes before they become obvious.
Using historical comparisons on FINNIFTY as of 13 October 2026
When evaluating today's IV, always ask: where does it sit relative to the past 30, 90, and 365 days? If it is at extremes in any of these comparisons, that extreme is a trading signal. The IV chart's lookback controls make these comparisons quick. A 1-minute check adds meaningful context to every trade decision.
Nifty Financial Services (FINNIFTY) IV Chart: Pro Tips
Tip 1: track FINNIFTY IV daily
Consistency is the highest-value habit. Check the Nifty Financial Services IV chart at the same time each day. Note the level, direction, and any unusual patterns. This daily check builds intuitive familiarity that enables faster decisions during live trading. The 2-minute investment pays off across dozens of trades.
Tip 2: know the event calendar
Most IV surprises come from events. If you know what is scheduled — RBI meetings, budget dates, election results, Fed decisions — you can anticipate IV movements rather than react to them. Mark these on your calendar and adjust your expectations in advance.
Tip 3: respect IV mean reversion
IV rarely stays at extremes for long. High IV tends to fall; low IV tends to rise. Trading with this mean-reversion bias (selling high, buying low) captures the statistical edge. Fighting it usually produces losses. The IV chart makes extremes visible so you can act on them.
Tip 4: journal your FINNIFTY IV observations
Keep a simple daily log: closing IV, change from yesterday, percentile versus history, and any event context. Over weeks this log reveals your personal IV patterns and improves your decision speed. As of 13 October 2026, journaling is the single most underrated habit in options trading for Nifty Financial Services.
Nifty Financial Services (FINNIFTY) IV Chart: Trading Around IV Extremes
What is an IV extreme on FINNIFTY?
An IV extreme is when Nifty Financial Services IV reaches the top or bottom of its recent range. These extremes are rare and often mark turning points — IV rarely stays at extremes for long and usually mean-reverts. Recognising extremes gives you high-probability trade setups because mean reversion is one of the most reliable patterns in volatility behaviour.
Trading extreme high IV on FINNIFTY
When IV reaches extreme highs (near the top of the 1-year range), sell premium with modest size. The mean-reversion odds favour you — IV will likely drift down, giving profits on short options positions. Risk management is critical because IV extremes can go further than expected before reverting. Use defined-risk structures like iron condors rather than naked shorts.
Trading extreme low IV on FINNIFTY
When IV reaches extreme lows, buy premium with modest size. The mean-reversion logic runs the other way — IV will likely expand, boosting long options positions. Long straddles and strangles work well because they benefit purely from volatility expansion, regardless of direction. Again, sizing matters because extremes can persist longer than you expect.
Timing IV extreme trades on FINNIFTY as of 13 October 2026
Do not enter at the first sign of an extreme — extremes can deepen. Wait for initial reversion (IV starts moving off the extreme) before entering. This confirmation reduces false starts. For Nifty Financial Services, patient IV extreme trades have high hit rates over the long run when executed with discipline.
IV Chart: Video Walkthrough
FINNIFTY IV Rank & IV Percentile: quick reference
| IVR / IVP band | Premium regime | Common strategy bias |
|---|---|---|
| Below 20% | Very cheap options | Buy premium — long straddles, strangles, debit spreads |
| 20% – 40% | Below-average IV | Lean buyer; prefer debit spreads over selling thin premium |
| 40% – 60% | Fair-value zone | No volatility edge; trade FINNIFTY direction, not vol |
| 60% – 80% | Elevated premium | Sell premium — credit spreads, iron condors |
| Above 80% | Extreme / event-driven IV | Rich premium, but check the event calendar before selling |
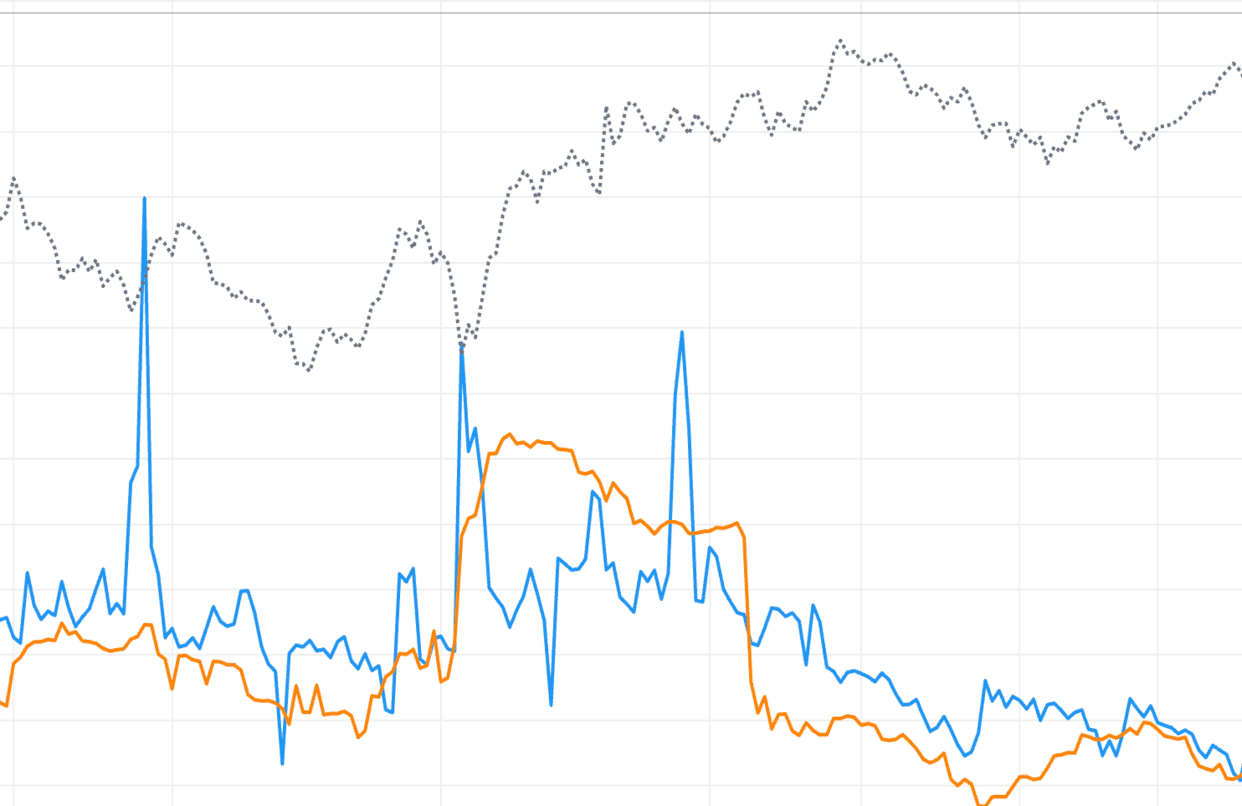
These bands are conventions used by NSE premium sellers, not fixed rules — ahead of a scheduled event a high IVR reading is normal and can persist until the event resolves. The live FINNIFTY chart above plots IVR and IVP against your chosen lookback, so you can see in real time which regime current option pricing sits in.
How to use the StockMojo IV Chart
- Select an underlying — Choose Nifty, BankNifty, or any F&O stock from the symbol selector.
- Read the current IV reading — The chart shows IV plotted over time. Note the latest value and where it sits relative to the visible range.
- Check IV Rank and IV Percentile — Look at the IV Rank and IV Percentile metrics displayed beside the chart. Values above 50% suggest elevated IV; below 50% suggest depressed IV.
- Compare IV vs HV — Toggle the historical volatility overlay. A wide gap (IV well above HV) signals overpriced options; a narrow or inverted gap signals underpriced options.
- Pick your strategy bias — Use the IV regime to bias toward premium selling (high IV) or premium buying (low IV) before entering a trade.
FINNIFTY IV Chart — Frequently Asked Questions
What is FINNIFTY implied volatility (IV)?
FINNIFTY implied volatility (IV) is the market's forward-looking estimate of how much FINNIFTY will move, derived by solving an option pricing model backwards from live NSE option premiums. High IV means options are expensive and a big move is priced in; low IV means options are cheap. IV measures expected magnitude of movement, not direction.
What is a good IV Rank (IVR) for selling FINNIFTY options?
An IV Rank above 50% is the common filter for selling FINNIFTY premium, and above 75% is a strong sell-side setup. IVR scales current IV between its 52-week low (0%) and high (100%), so a high reading means options are rich versus the past year. Below 25%, premium is cheap and buying strategies are favoured instead.
What is the difference between IV, HV and RV on the FINNIFTY chart?
IV is the forward-looking volatility implied by current FINNIFTY option prices, HV (historical volatility) measures actual movement over a past window, and RV (realised volatility) tracks what price is doing right now. When IV trades well above HV, FINNIFTY options are overpriced relative to real movement — an edge for premium sellers; a narrow or inverted gap favours buyers.
What causes an IV crush in FINNIFTY options?
IV crush is the rapid collapse of implied volatility once a scheduled event resolves the uncertainty that was inflating it. For FINNIFTY, common triggers are RBI policy meetings, the Union Budget, election results, quarterly earnings and major global data. Premiums deflate within minutes even when the direction was right, so option buyers avoid entering at pre-event IV peaks.
How often does the FINNIFTY IV chart update?
During NSE market hours (9:15 AM to 3:40 PM IST) the FINNIFTY IV chart refreshes every minute, recomputing IV from live option premiums alongside HV, RV and the futures price. IVP and IVR are recalculated against your selected lookback (default 252 sessions). Outside market hours the chart shows the last traded session's readings.
Learn more
Read our guide: IV Rank vs IV Percentile: Which Should Option Sellers Use?