SBIN Smart Open Interest Analysis | Live NSE Data
Analyze SBIN Smart Open Interest to spot where institutional traders are positioning. Our tool scans OI buildup across every strike in the SBIN option chain, automatically flagging zones of concentrated long and short activity. Instead of reading each strike manually, you see the high-conviction levels in seconds — a clear edge during fast-moving NSE sessions.
In SBIN options, institutional flow often clusters into three or four adjacent strikes rather than a single strike. Smart OI identifies these clusters, highlights the dominant side (call writing vs put writing), and tracks how the zones shift intraday. When the call-writer zone starts unwinding while price approaches it, that's the typical pre-breakout signature for SBIN. Put-writer zones, on the other hand, tend to act as durable support as long as OI keeps building.
How to use SBIN Smart OI during a trading session
By 10:30 AM, Smart OI has usually identified the day's SBIN institutional support and resistance zones. Traders can then structure intraday strategies — range-selling strangles between the zones, directional positions aligned with unwinding flow, or hedges when a key zone breaks. In historical mode you can replay any past SBIN session to study how the institutional footprint evolved, which is valuable for back-testing and understanding pre-event positioning.
Pair Smart OI with our Live Option Chain, Max Pain Calculator, and Multi-Strike OI tools for a complete picture of theSBIN F&O landscape across strikes and expiries.
State Bank of India (SBIN) Smart OI: What the Tool Does
What is Smart OI for SBIN?
Smart OI is an automated analysis tool that scans the State Bank of India (SBIN) option chain and highlights the most significant open interest levels for you. Instead of manually scrolling through every strike to find where real positioning is, Smart OI surfaces the handful of strikes that matter most. It filters out the noise and leaves you with a focused view of SBIN support, resistance, and active positioning zones.
How does Smart OI identify key levels?
The tool analyses total OI, OI change, volume, and buildup patterns together. A strike shows up on the Smart OI radar when multiple signals align — high absolute OI plus meaningful OI change plus reasonable volume. Strikes that look big in isolation but have no volume or no recent change are filtered out. As a NIFTY and BANKNIFTY and FINNIFTY constituent, SBIN has enough active strikes that this filtering is essential to avoid overload.
Why use Smart OI instead of the full option chain?
The option chain shows everything. That is useful for deep analysis but overwhelming for day-to-day decisions. Smart OI is the shortcut: it gives you the 3-5 strikes that actually matter for trading State Bank of India today, based on live data. You spend less time scanning and more time deciding and executing.
Getting started with SBIN Smart OI today
As of 6 October 2026, open the Smart OI tool and look at which strikes it highlights. These are your starting reference points for the day. Compare the highlighted strikes against current spot. Strikes above spot are likely resistance zones; strikes below are likely support. In minutes you have a trading framework ready.
State Bank of India (SBIN) Smart OI: Support Zone Analysis
How Smart OI identifies SBIN support zones
Support zones on State Bank of India are strikes where put open interest is high and growing. Smart OI automatically flags these strikes as potential support levels. The tool prioritises strikes with both high OI and recent fresh positioning — indicating that put writers are actively defending the level, not just sitting on old positions.
Strong versus weak SBIN support
Strong support is a Smart OI strike with 3-5 sessions of sustained put writing and large total OI. Weak support has just one session of activity or thin overall positioning. Strong support typically holds; weak support often breaks. Smart OI gives you the data to distinguish between the two.
Trading SBIN bounces at support
When SBIN price falls to a Smart OI support level, watch for signs of a bounce. If fresh put writing is happening in real time (tool continues to flag the strike with fresh activity), the bounce is more likely. If put OI is unwinding, support may be breaking. Confirm with price action before entering long.
Stop-loss placement at SBIN support as of 6 October 2026
For long trades, place stops below the next Smart OI support level (not the one you entered at). If the second support also breaks, the entire support structure is failing. For State Bank of India this cascading approach keeps your stops rational rather than arbitrary.
State Bank of India (SBIN) Smart OI: Common Mistakes
Mistake 1: Treating Smart OI as a trade signal alone
Smart OI shows you where positioning is, not whether to trade it. Using it as a standalone trade signal without considering price action, context, or broader market conditions leads to inconsistent results. Always treat Smart OI outputs as one input among several for State Bank of India decisions.
Mistake 2: Ignoring time context
A Smart OI level that was dominant yesterday may be irrelevant today if price has moved far away from it. Always check whether the flagged strikes are still near current price. Stale levels that are now far from spot have diminished influence. The tool updates but you have to mentally adjust as well.
Mistake 3: Overreacting to single-session signals
One session of Smart OI data is noise. Patterns across 3-5 sessions are signal. Beginners often react to every daily shift and generate many low-quality trades. Wait for persistence before acting on a new signal. Single-session changes are usually reversed the next day on SBIN.
Mistake 4: Forgetting the event calendar on SBIN
Smart OI signals are less reliable around major events. Pre-event hedging distorts the positioning picture. Always check the economic and corporate calendar before trading Smart OI signals. As of 6 October 2026, a 2-minute calendar check prevents most event-driven losses on State Bank of India.
SBIN Open Interest Snapshot — 6 Oct 2026 Close
SBIN futures ended the 6 Oct session at 959.75, down 0.32% from the previous close, after moving between 955.7 and 964.5. Futures OI added 12.16 L through the day — the classic short buildup signature.
In the 27 Oct option series, call OI closed at 4.08 Cr (+39.90 L on the day) and put OI at 3.45 Cr (+4.97 L): both calls and puts attracted new OI, and the call side absorbed the larger share. The closing put-call ratio stood at 0.85, close to neutral territory between call and put writers.
| Data date | Tuesday, 6 October 2026 |
| Futures close | 959.75 (-0.32%) |
| Day range (futures) | 955.7 – 964.5 |
| Futures OI change | +12.16 L |
| Call OI (close) | 4.08 Cr (+39.90 L on the day) |
| Put OI (close) | 3.45 Cr (+4.97 L on the day) |
| Put-Call Ratio (OI) | 0.85 |
| Call / Put volume | 3.71 Cr / 2.03 Cr |
| Lot size | 750 |
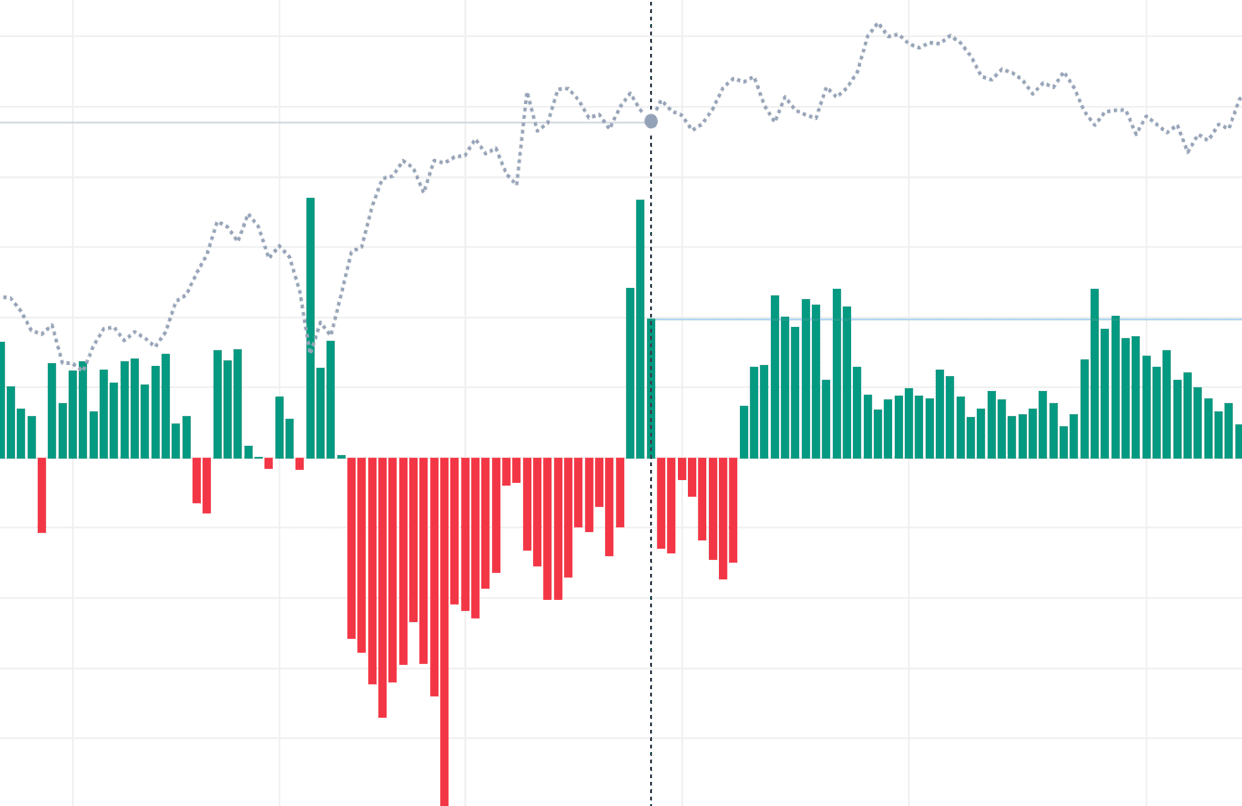
Data as of 2026-10-06 market close · 2026-10-27 expiry · same NSE feed as the chart above · refreshed with every site update. For educational purposes only, not investment advice.
Smart OI Detection: Video Walkthrough
SBIN smart-money OI: quick reference
| Sudden OI surge | Likely actor | Smart-money read on SBIN |
|---|---|---|
| Call OI jumps at a strike above spot | Call writers (sellers) | Fresh resistance ceiling — institutions expect SBIN to stay capped below that strike |
| Put OI jumps at a strike below spot | Put writers (sellers) | Fresh support floor — institutions defending that level |
| Call OI jumps while price breaks higher | Call buyers | Directional long bet — old resistance can flip into a breakout target |
| Put OI jumps while price breaks lower | Put buyers / hedgers | Directional short or downside hedge — support below may not hold |
| Heavy OI unwinds at a wall as spot nears it | Writers covering | Support/resistance dissolving — classic pre-breakout or trap setup |
These reads are strongest when several adjacent SBIN strikes light up together — a cluster signals a structured institutional position, not one-off retail flow. Treat a single strike as a hint and a zone as conviction. Always confirm the smart-money signal against price action before trading; OI shows where money is committed, not which way it will break.
How to use the Smart OI tool
- Select an underlying — Choose Nifty, BankNifty, or an F&O stock to monitor for institutional flow.
- Read the current Smart OI signal — Look at the live classification — long buildup, short buildup, unwind, or neutral — and the timestamp it was generated.
- Watch for signal transitions — A change from buildup to unwind (or vice versa) is more actionable than a continuing signal in the same direction.
- Cross-reference with price action — Compare the Smart OI signal with the underlying's chart — confirmation in both is the highest-confidence setup.
- Combine with PCR and Max Pain — Use PCR for sentiment context and Max Pain for the expiry-day target. Smart OI tells you when institutions are committing.
SBIN Smart OI — Frequently Asked Questions
What is SBIN Smart OI?
SBIN Smart OI is an intelligent open interest analysis tool that automatically identifies significant OI levels, buildup patterns, and potential support/resistance zones based on OI concentration.
How does Smart OI help in SBIN trading?
Smart OI for SBIN highlights the most important OI levels automatically, saving time in analysis. It identifies where smart money is positioning and potential breakout/breakdown levels.
How do I tell smart-money call writing from call buying in SBIN Smart OI?
In SBIN Smart OI, a large call OI surge while price stays flat or falls signals institutional call writing — that strike becomes resistance. The same OI surge alongside a sharp price rise signals aggressive call buying, a directional long bet. Reading OI change together with price separates writers defending a level from buyers chasing a breakout.
What does a large sudden OI addition at a SBIN strike mean?
A large sudden OI addition marks where smart money is committing capital. Heavy put writing below spot builds institutional support; heavy call writing above spot builds resistance. When that OI abruptly unwinds as SBIN approaches the strike, the wall is dissolving — often a trap or pre-breakout signal rather than a level that will hold.
How often does SBIN Smart OI update?
During NSE market hours (9:15 AM to 3:40 PM IST) SBIN Smart OI recomputes per-strike OI changes on every option-chain refresh — typically every 1-3 seconds — so institutional flow appears as it develops. Outside market hours it shows the last session, and historical mode replays smart-money positioning for any past SBIN expiry.