HDFCBANK Smart Open Interest Analysis | Live NSE Data
Analyze HDFCBANK Smart Open Interest to spot where institutional traders are positioning. Our tool scans OI buildup across every strike in the HDFCBANK option chain, automatically flagging zones of concentrated long and short activity. Instead of reading each strike manually, you see the high-conviction levels in seconds — a clear edge during fast-moving NSE sessions.
In HDFCBANK options, institutional flow often clusters into three or four adjacent strikes rather than a single strike. Smart OI identifies these clusters, highlights the dominant side (call writing vs put writing), and tracks how the zones shift intraday. When the call-writer zone starts unwinding while price approaches it, that's the typical pre-breakout signature for HDFCBANK. Put-writer zones, on the other hand, tend to act as durable support as long as OI keeps building.
How to use HDFCBANK Smart OI during a trading session
By 10:30 AM, Smart OI has usually identified the day's HDFCBANK institutional support and resistance zones. Traders can then structure intraday strategies — range-selling strangles between the zones, directional positions aligned with unwinding flow, or hedges when a key zone breaks. In historical mode you can replay any past HDFCBANK session to study how the institutional footprint evolved, which is valuable for back-testing and understanding pre-event positioning.
Pair Smart OI with our Live Option Chain, Max Pain Calculator, and Multi-Strike OI tools for a complete picture of theHDFCBANK F&O landscape across strikes and expiries.
HDFC Bank Ltd (HDFCBANK) Smart OI: Combining With Other Tools
HDFCBANK Smart OI plus option chain
The option chain shows everything; Smart OI shows what matters most. Use Smart OI to identify key strikes, then drill into the option chain for detailed Greeks, IV, and surrounding strike data. The combination covers breadth (option chain) and focus (Smart OI) simultaneously on HDFC Bank Ltd.
HDFCBANK Smart OI plus PCR
PCR gives overall sentiment; Smart OI gives specific strike focus. When both agree — e.g., bullish PCR plus bullish Smart OI — the signal is very strong. When they disagree, investigate why. Often the divergence is an early signal of a sentiment shift that has not fully shown up in aggregate measures yet.
HDFCBANK Smart OI plus multi-strike chart
Multi-strike chart shows premium movement; Smart OI identifies the key strikes to watch. The ideal workflow: let Smart OI pick the 5-6 strikes for your multi-strike chart, then watch their premium dynamics throughout the session. This combination is efficient and comprehensive for HDFC Bank Ltd.
Building a HDFCBANK dashboard as of 6 October 2026
A complete dashboard: Smart OI for key levels, option chain for detail, multi-strike chart for premium tracking, PCR for sentiment, and price chart for direction. All five in one view gives you a pro-level analysis setup. Start with Smart OI because it tells you what to focus on.
HDFC Bank Ltd (HDFCBANK) Smart OI: Resistance Zone Analysis
How Smart OI identifies HDFCBANK resistance zones
Resistance zones on HDFC Bank Ltd are strikes where call open interest is high and growing. The Smart OI tool flags them automatically. As with support, the tool prioritises strikes with both magnitude and momentum — high OI plus fresh activity. These are the strikes where HDFCBANK is most likely to face selling pressure.
Strong versus weak HDFCBANK resistance
A strong resistance has persistent call writing over multiple sessions plus significant volume. A weak resistance shows only one session of activity or has low volume. Strong resistance typically holds through multiple price tests. Weak resistance often breaks on the first real attempt. Smart OI surfaces both but your interpretation should differ.
Trading HDFCBANK rejections at resistance
When HDFCBANK rallies to a Smart OI resistance level, watch for rejection signs. Fresh call writing continuing to build = strong defence. Call OI starting to unwind at the level = resistance giving way (breakout incoming). This real-time monitoring is what makes Smart OI more actionable than static level analysis.
Target setting using HDFCBANK resistance as of 6 October 2026
For short trades from resistance, target the nearest Smart OI support level below. For long trades, use the next resistance above as your target. This keeps your risk-reward ratios rooted in real options positioning rather than arbitrary chart levels.
HDFC Bank Ltd (HDFCBANK) Smart OI: Automated Key Level Detection
What makes a level "key" on HDFCBANK?
A key level is one where market participants have committed significant capital. For HDFC Bank Ltd, a key level usually has high total OI, recent fresh activity, and confirms with volume. Smart OI automatically finds strikes that meet these criteria so you do not have to build the analysis by hand.
How Smart OI ranks HDFCBANK strikes
Internally, the tool scores each strike based on a combination of OI magnitude, recent change direction, and activity level. The highest-scoring strikes become the focus. This ranking updates in real time as new data arrives, so your key levels evolve through the session. Early-session levels may differ from closing levels as activity shifts.
Acting on Smart OI levels for HDFCBANK trades
When HDFC Bank Ltd approaches a Smart OI level, expect a reaction. Support levels often see bouncing activity. Resistance levels often face selling pressure. The reactions are not guaranteed — sometimes levels break — but the probability of a reaction is higher at Smart OI levels than at random strikes.
Reviewing HDFCBANK Smart OI daily as of 6 October 2026
Make a habit of checking Smart OI at market open and market close. The open tells you which levels will likely matter today. The close tells you which levels matter for tomorrow. These two checkpoints are enough for most HDFCBANK trading workflows.
HDFCBANK Open Interest Snapshot — 6 Oct 2026 Close
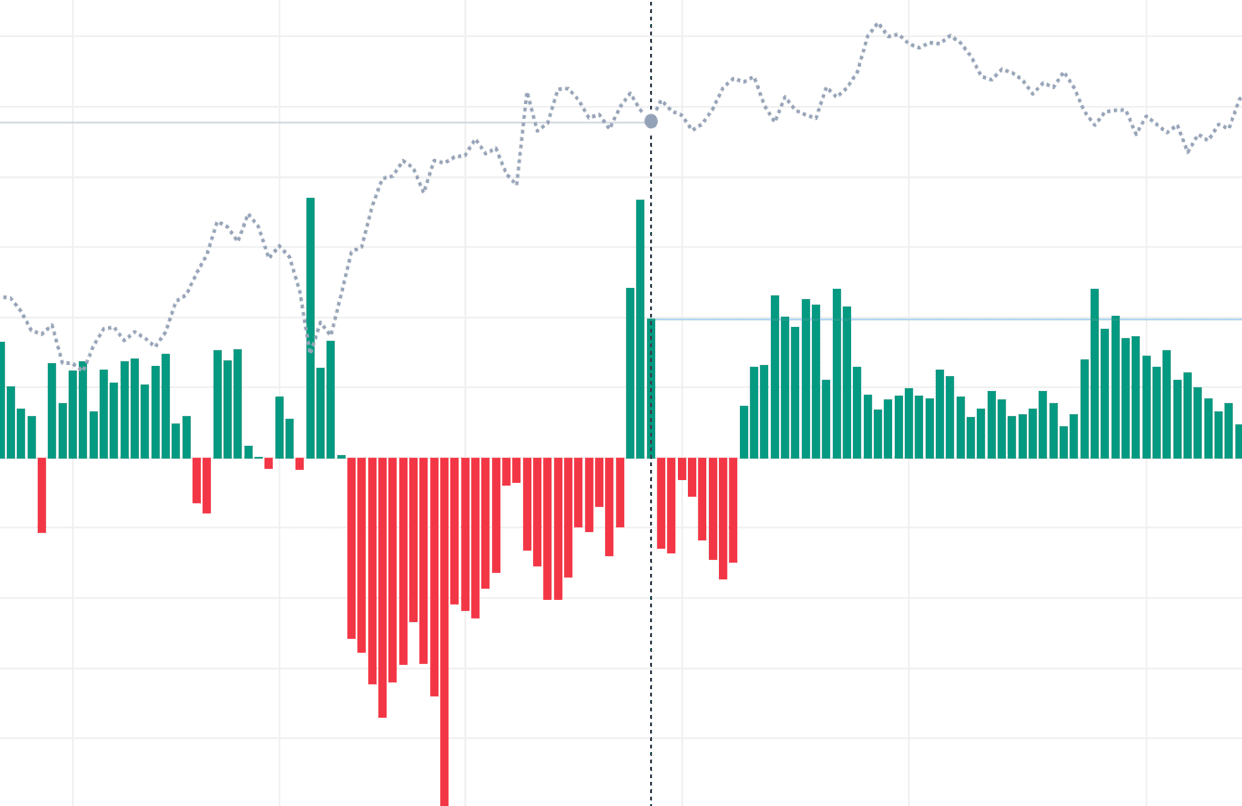
HDFCBANK futures ended the 6 Oct session at 711.65, up 0.77% from the previous close, after moving between 702.6 and 716.5. Futures OI added 33.50 L through the day — the classic long buildup signature.
In the 27 Oct option series, call OI closed at 13.51 Cr (-10.76 L on the day) and put OI at 7.16 Cr (-4.07 L): open interest shrank on both sides as traders unwound existing positions. The closing put-call ratio stood at a call-heavy 0.53, with call writing dominating the book.
| Data date | Tuesday, 6 October 2026 |
| Futures close | 711.65 (+0.77%) |
| Day range (futures) | 702.6 – 716.5 |
| Futures OI change | +33.50 L |
| Call OI (close) | 13.51 Cr (-10.76 L on the day) |
| Put OI (close) | 7.16 Cr (-4.07 L on the day) |
| Put-Call Ratio (OI) | 0.53 |
| Call / Put volume | 12.71 Cr / 5.59 Cr |
| Lot size | 650 |
Data as of 2026-10-06 market close · 2026-10-27 expiry · same NSE feed as the chart above · refreshed with every site update. For educational purposes only, not investment advice.
Smart OI Detection: Video Walkthrough
HDFCBANK smart-money OI: quick reference
| Sudden OI surge | Likely actor | Smart-money read on HDFCBANK |
|---|---|---|
| Call OI jumps at a strike above spot | Call writers (sellers) | Fresh resistance ceiling — institutions expect HDFCBANK to stay capped below that strike |
| Put OI jumps at a strike below spot | Put writers (sellers) | Fresh support floor — institutions defending that level |
| Call OI jumps while price breaks higher | Call buyers | Directional long bet — old resistance can flip into a breakout target |
| Put OI jumps while price breaks lower | Put buyers / hedgers | Directional short or downside hedge — support below may not hold |
| Heavy OI unwinds at a wall as spot nears it | Writers covering | Support/resistance dissolving — classic pre-breakout or trap setup |
These reads are strongest when several adjacent HDFCBANK strikes light up together — a cluster signals a structured institutional position, not one-off retail flow. Treat a single strike as a hint and a zone as conviction. Always confirm the smart-money signal against price action before trading; OI shows where money is committed, not which way it will break.
How to use the Smart OI tool
- Select an underlying — Choose Nifty, BankNifty, or an F&O stock to monitor for institutional flow.
- Read the current Smart OI signal — Look at the live classification — long buildup, short buildup, unwind, or neutral — and the timestamp it was generated.
- Watch for signal transitions — A change from buildup to unwind (or vice versa) is more actionable than a continuing signal in the same direction.
- Cross-reference with price action — Compare the Smart OI signal with the underlying's chart — confirmation in both is the highest-confidence setup.
- Combine with PCR and Max Pain — Use PCR for sentiment context and Max Pain for the expiry-day target. Smart OI tells you when institutions are committing.
HDFCBANK Smart OI — Frequently Asked Questions
What is HDFCBANK Smart OI?
HDFCBANK Smart OI is an intelligent open interest analysis tool that automatically identifies significant OI levels, buildup patterns, and potential support/resistance zones based on OI concentration.
How does Smart OI help in HDFCBANK trading?
Smart OI for HDFCBANK highlights the most important OI levels automatically, saving time in analysis. It identifies where smart money is positioning and potential breakout/breakdown levels.
How do I tell smart-money call writing from call buying in HDFCBANK Smart OI?
In HDFCBANK Smart OI, a large call OI surge while price stays flat or falls signals institutional call writing — that strike becomes resistance. The same OI surge alongside a sharp price rise signals aggressive call buying, a directional long bet. Reading OI change together with price separates writers defending a level from buyers chasing a breakout.
What does a large sudden OI addition at a HDFCBANK strike mean?
A large sudden OI addition marks where smart money is committing capital. Heavy put writing below spot builds institutional support; heavy call writing above spot builds resistance. When that OI abruptly unwinds as HDFCBANK approaches the strike, the wall is dissolving — often a trap or pre-breakout signal rather than a level that will hold.
How often does HDFCBANK Smart OI update?
During NSE market hours (9:15 AM to 3:40 PM IST) HDFCBANK Smart OI recomputes per-strike OI changes on every option-chain refresh — typically every 1-3 seconds — so institutional flow appears as it develops. Outside market hours it shows the last session, and historical mode replays smart-money positioning for any past HDFCBANK expiry.