RELIANCE Smart Open Interest Analysis | Live NSE Data
Analyze RELIANCE Smart Open Interest to spot where institutional traders are positioning. Our tool scans OI buildup across every strike in the RELIANCE option chain, automatically flagging zones of concentrated long and short activity. Instead of reading each strike manually, you see the high-conviction levels in seconds — a clear edge during fast-moving NSE sessions.
In RELIANCE options, institutional flow often clusters into three or four adjacent strikes rather than a single strike. Smart OI identifies these clusters, highlights the dominant side (call writing vs put writing), and tracks how the zones shift intraday. When the call-writer zone starts unwinding while price approaches it, that's the typical pre-breakout signature for RELIANCE. Put-writer zones, on the other hand, tend to act as durable support as long as OI keeps building.
How to use RELIANCE Smart OI during a trading session
By 10:30 AM, Smart OI has usually identified the day's RELIANCE institutional support and resistance zones. Traders can then structure intraday strategies — range-selling strangles between the zones, directional positions aligned with unwinding flow, or hedges when a key zone breaks. In historical mode you can replay any past RELIANCE session to study how the institutional footprint evolved, which is valuable for back-testing and understanding pre-event positioning.
Pair Smart OI with our Live Option Chain, Max Pain Calculator, and Multi-Strike OI tools for a complete picture of theRELIANCE F&O landscape across strikes and expiries.
Reliance Industries Ltd (RELIANCE) Smart OI: Pro Tips
Tip 1: track level evolution over days
Smart OI levels for Reliance Industries Ltd shift gradually. A strike that appears as key today may evolve into a dominant level over the next 3-4 sessions. Tracking this evolution (through the historical mode) gives you predictive insight — you can see momentum building before levels become unmistakably important.
Tip 2: watch for new RELIANCE levels emerging
A new strike appearing in Smart OI that was not there yesterday is particularly valuable. It means fresh positioning is happening now. Whether it is a new support or resistance depends on the side. Either way, new levels deserve attention because they represent current market thinking.
Tip 3: cross-reference with FII data
For Reliance Industries Ltd as a stock, cross-reference Smart OI with sector-level institutional flows and broader market conditions to understand whether the positioning is stock-specific or broader.
Tip 4: journal your RELIANCE Smart OI observations
Write down daily observations: which levels were flagged, how they behaved, whether your trades aligned with them, and what happened next. Over 30-60 days this log becomes priceless. As of 6 October 2026, the trader who journals consistently outperforms the one who trades reactively without a written record. As a NIFTY constituent, Reliance Industries Ltd rewards this discipline.
Reliance Industries Ltd (RELIANCE) Smart OI: Live vs Historical Modes
What live Smart OI shows for RELIANCE
Live mode displays Smart OI signals updating in real time during NSE market hours. As fresh OI hits the market, the tool re-evaluates strike rankings and may show new flagged levels. This dynamic view is essential for active intraday trading on Reliance Industries Ltd — the signal landscape can shift multiple times per day.
Why historical mode matters for RELIANCE
Historical mode lets you replay Smart OI for any past trading day. You select a date and see exactly which strikes were key on that day. This is invaluable for studying how key levels behaved before major RELIANCE moves — were they respected? Broken? Ignored? The answers help calibrate your live interpretation.
Comparing past and present on RELIANCE
A useful exercise: pick a recent Reliance Industries Ltd move and pull up the Smart OI from a few days before. What did it show? Did it predict the move? If yes, what specific patterns preceded the move? These retrospective studies build your pattern recognition far faster than live observation alone.
Building a RELIANCE pattern library as of 6 October 2026
Over weeks of historical study, you accumulate a library of Smart OI patterns that preceded various types of moves. When today's live Smart OI starts looking similar to one of your library patterns, you have an informed guess about what is coming. This is how experienced traders develop intuition — through disciplined study of past data.
Reliance Industries Ltd (RELIANCE) Smart OI: Multi-Expiry View
Why look at multiple RELIANCE expiries
Reliance Industries Ltd has both weekly and monthly expiries. Each expiry has its own Smart OI landscape. By checking multiple expiries, you understand short-term versus medium-term positioning. Short-term (weekly) shows tactical positioning; monthly shows strategic institutional bias. Reading both gives a richer picture.
Comparing weekly and monthly on RELIANCE
If weekly Smart OI shows bearish positioning but monthly shows bullish, short-term concerns overlay a medium-term bullish view. A dip is possible, but the bigger trend may be up. Trade accordingly — small tactical shorts with a longer-term bullish bias. When both expiries agree, conviction is highest.
Rollover patterns on RELIANCE
In the final days of an expiry, positions roll to the next month. Smart OI captures this rolling activity. If traders roll to similar levels in the next expiry, they maintain their conviction. If they roll to different strikes, they are adjusting their view. Watching rollover is a smart-money tracking technique.
Using multi-expiry Smart OI as of 6 October 2026
Check both weekly and monthly Smart OI at least once per session. Two minutes of comparison work adds meaningful context to your trading decisions. As of 6 October 2026, this habit differentiates informed traders from those who only look at the nearest expiry.
RELIANCE Open Interest Snapshot — 6 Oct 2026 Close
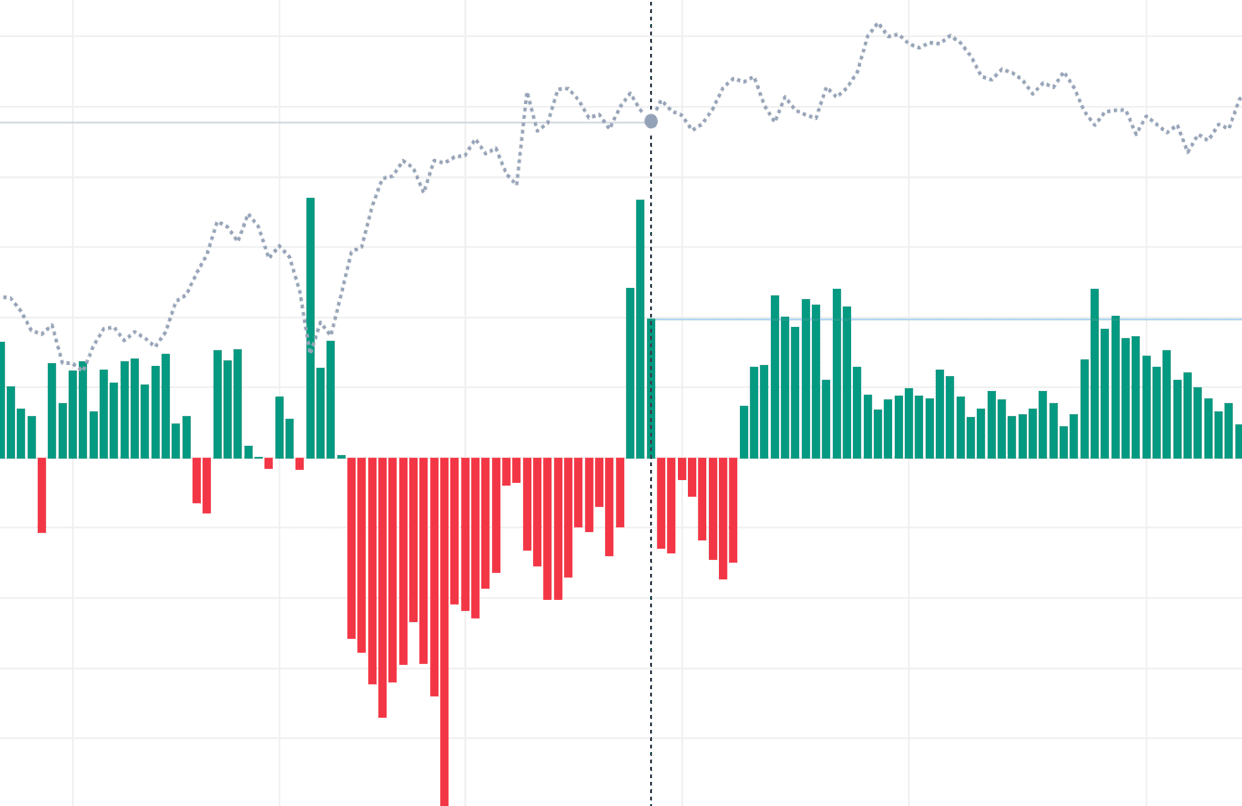
RELIANCE futures ended the 6 Oct session at 1,220, up 2.18% from the previous close, after moving between 1,195 and 1,222.6. Futures OI shed 16.68 L through the day — the classic short covering signature.
In the 27 Oct option series, call OI closed at 6.35 Cr (-14.74 L on the day) and put OI at 4.71 Cr (-13.29 L): both call and put OI were unwound — a position-lightening session. The closing put-call ratio stood at 0.74, on the lower side, with calls clearly outweighing puts.
| Data date | Tuesday, 6 October 2026 |
| Futures close | 1,220 (+2.18%) |
| Day range (futures) | 1,195 – 1,222.6 |
| Futures OI change | -16.68 L |
| Call OI (close) | 6.35 Cr (-14.74 L on the day) |
| Put OI (close) | 4.71 Cr (-13.29 L on the day) |
| Put-Call Ratio (OI) | 0.74 |
| Call / Put volume | 9.43 Cr / 4.61 Cr |
| Lot size | 500 |
Data as of 2026-10-06 market close · 2026-10-27 expiry · same NSE feed as the chart above · refreshed with every site update. For educational purposes only, not investment advice.
Smart OI Detection: Video Walkthrough
RELIANCE smart-money OI: quick reference
| Sudden OI surge | Likely actor | Smart-money read on RELIANCE |
|---|---|---|
| Call OI jumps at a strike above spot | Call writers (sellers) | Fresh resistance ceiling — institutions expect RELIANCE to stay capped below that strike |
| Put OI jumps at a strike below spot | Put writers (sellers) | Fresh support floor — institutions defending that level |
| Call OI jumps while price breaks higher | Call buyers | Directional long bet — old resistance can flip into a breakout target |
| Put OI jumps while price breaks lower | Put buyers / hedgers | Directional short or downside hedge — support below may not hold |
| Heavy OI unwinds at a wall as spot nears it | Writers covering | Support/resistance dissolving — classic pre-breakout or trap setup |
These reads are strongest when several adjacent RELIANCE strikes light up together — a cluster signals a structured institutional position, not one-off retail flow. Treat a single strike as a hint and a zone as conviction. Always confirm the smart-money signal against price action before trading; OI shows where money is committed, not which way it will break.
How to use the Smart OI tool
- Select an underlying — Choose Nifty, BankNifty, or an F&O stock to monitor for institutional flow.
- Read the current Smart OI signal — Look at the live classification — long buildup, short buildup, unwind, or neutral — and the timestamp it was generated.
- Watch for signal transitions — A change from buildup to unwind (or vice versa) is more actionable than a continuing signal in the same direction.
- Cross-reference with price action — Compare the Smart OI signal with the underlying's chart — confirmation in both is the highest-confidence setup.
- Combine with PCR and Max Pain — Use PCR for sentiment context and Max Pain for the expiry-day target. Smart OI tells you when institutions are committing.
RELIANCE Smart OI — Frequently Asked Questions
What is RELIANCE Smart OI?
RELIANCE Smart OI is an intelligent open interest analysis tool that automatically identifies significant OI levels, buildup patterns, and potential support/resistance zones based on OI concentration.
How does Smart OI help in RELIANCE trading?
Smart OI for RELIANCE highlights the most important OI levels automatically, saving time in analysis. It identifies where smart money is positioning and potential breakout/breakdown levels.
How do I tell smart-money call writing from call buying in RELIANCE Smart OI?
In RELIANCE Smart OI, a large call OI surge while price stays flat or falls signals institutional call writing — that strike becomes resistance. The same OI surge alongside a sharp price rise signals aggressive call buying, a directional long bet. Reading OI change together with price separates writers defending a level from buyers chasing a breakout.
What does a large sudden OI addition at a RELIANCE strike mean?
A large sudden OI addition marks where smart money is committing capital. Heavy put writing below spot builds institutional support; heavy call writing above spot builds resistance. When that OI abruptly unwinds as RELIANCE approaches the strike, the wall is dissolving — often a trap or pre-breakout signal rather than a level that will hold.
How often does RELIANCE Smart OI update?
During NSE market hours (9:15 AM to 3:40 PM IST) RELIANCE Smart OI recomputes per-strike OI changes on every option-chain refresh — typically every 1-3 seconds — so institutional flow appears as it develops. Outside market hours it shows the last session, and historical mode replays smart-money positioning for any past RELIANCE expiry.