SBIN Futures Intraday Chart today | Live NSE F&O Data
Analyze SBIN futures intraday movements with StockMojo's real-time charting tool. Track live price action, open interest (OI) shifts, and volume spikes on a minute-by-minute basis to stay ahead of market trends.
Our SBIN futures terminal provides a comprehensive view of derivative market activity. Monitor institutional positioning and retail participation through high-frequency OI updates. Identify key intra-day levels where buying or selling pressure is building up. Whether you are scalping or swing trading, having access to live SBIN future data combined with historical context is essential for managing risk and optimizing entry/exit points.
Complement your intraday research with our Open Interest Analysis,Price vs OI Divergence, and Smart OI tools.
State Bank of India (SBIN) Future Intraday: OI During the Session
How futures OI changes intraday on SBIN
Futures open interest reflects outstanding positions. During the session, OI changes as new positions are created or closed. Rising OI means fresh money is entering. Falling OI means positions are being closed. The direction of these changes tells you about conviction on State Bank of India.
Rising OI with rising price
Rising OI while SBIN price rises is Long Buildup — fresh buyers entering. This is the strongest bullish signal on the futures tool. The move has genuine commitment behind it. Expect continuation rather than quick reversal.
Rising OI with falling price
Rising OI while State Bank of India price falls is Short Buildup — fresh sellers entering. This is the strongest bearish signal. The decline has real conviction. Expect further pressure on price until the pattern breaks.
Falling OI scenarios on SBIN as of 13 October 2026
Falling OI with rising price is Short Covering — weaker bullish signal. Falling OI with falling price is Long Unwinding — weaker bearish signal. Both indicate moves without fresh commitment. Less reliable for continuation trades than rising-OI patterns.
State Bank of India (SBIN) Future Intraday: Gap-Up and Gap-Down Openings
Reading SBIN gap openings
A gap opening happens when State Bank of India futures open significantly higher or lower than the previous close. These gaps typically come from overnight news or global market moves. The tool shows the gap immediately at the open. The direction and magnitude matter for how the rest of the session plays out.
Trading gap-up on SBIN
A gap-up with rising volume and OI indicates genuine bullish strength. The gap usually holds or extends. Enter long positions in the direction of the gap with a stop below the gap level. A gap that fills quickly (price returns to the previous close) signals weakness — switch to cautious or short bias.
Trading gap-down on SBIN
A gap-down with rising volume and OI indicates genuine bearish pressure. The gap often extends further before reversing. Enter short positions with a stop above the gap. A gap that fills quickly signals buying interest — consider long setups after the fill.
Gap failures on SBIN as of 13 October 2026
Not all gaps continue. About 30-40% of gaps get filled during the session. Watch the first hour closely after a gap. If price starts moving against the gap direction with rising volume, the gap will likely fill. This is a classic reversal trade setup on State Bank of India futures.
State Bank of India (SBIN) Future Intraday: Event-Driven Trading
How events affect SBIN futures
Major events (State Bank of India earnings, corporate announcements, sector news) cause sharp moves in futures. Volume spikes, OI shifts dramatically, and basis can distort. The tool shows these shifts in real time, giving experienced traders the chance to profit from event-driven volatility.
Pre-event preparation
Before known events, reduce position size. Expect volatility. Have a plan for both directions. Do not guess the outcome — let price reveal the direction and then trade in alignment. Trying to predict events usually produces losses because the market is already pricing in expectations.
Post-event trading on SBIN
After the event reveals the outcome, State Bank of India futures often move sharply. The initial move is usually too fast to trade safely. Wait for the first pullback, then enter in the trend direction with tight stops. This patient approach gets better entries than chasing the initial spike.
Managing event risk as of 13 October 2026
Event-driven trades can produce outsized gains but also outsized losses. Use defined-risk structures when possible. Always know the maximum loss before entering. Never average down during events — stops can be wiped out quickly when volatility is extreme on SBIN futures.
SBIN futures price vs OI: quick reference
| Price | Open interest | Regime | Common reading |
|---|---|---|---|
| Rising | Rising | Long buildup | Fresh longs entering; strongest bullish signal on SBIN |
| Falling | Rising | Short buildup | Fresh shorts entering; strongest bearish signal |
| Rising | Falling | Short covering | Shorts exiting; weaker rally that often stalls once covering ends |
| Falling | Falling | Long unwinding | Longs exiting without new sellers; weaker bearish signal |
| Flat | Rising | Accumulation | Positions building ahead of a move; watch for the breakout direction |
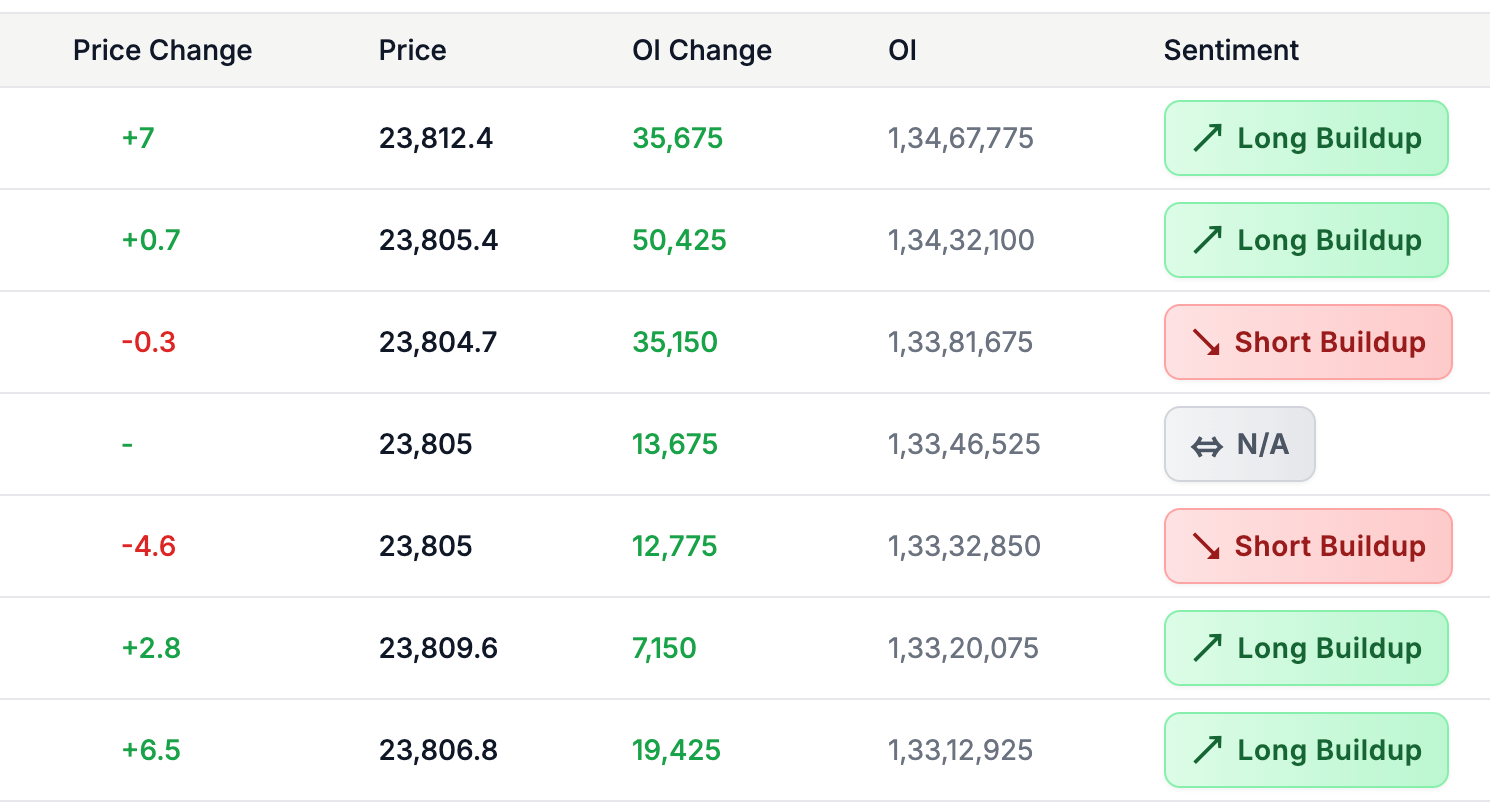
These four price-OI regimes are the standard NSE futures read: rising-OI moves carry fresh institutional commitment, falling-OI moves are position exits and fade more often. The live SBIN table above classifies every 3, 5, or 15-minute interval into one of these regimes, so you can see which side is committing money in real time.
How to use the Future Intraday Chart
- Pick the symbol — Choose Nifty, BankNifty, or any F&O stock. Index futures are the default for most intraday traders.
- Pick the contract month — Near-month is where the volume lives. Switch to next-month if you're studying rollover behaviour around expiry week.
- Read the price and OI lines together — Identify the regime: long buildup, short buildup, short covering, or long unwinding. The colour coding above the chart names it for you.
- Mark the opening-hour reading — Whatever positioning prints between 9:15 and 10:30 IST often dictates the day's bias. Note it.
- Watch the final hour — The 2:30 to 3:30 IST window reveals whether positions are being held overnight or unwound. Carry-forward longs are bullish; aggressive late-day unwinds usually aren't.
SBIN Futures Intraday — Frequently Asked Questions
How to track SBIN futures intraday?
Track SBIN futures intraday by watching the live futures price and open interest together, minute by minute. Rising price with rising OI signals long buildup (bullish conviction); rising price with falling OI signals short covering (a weaker move). StockMojo's chart plots both through the NSE session and classifies each interval automatically.
What is SBIN futures OI analysis?
SBIN futures OI is the total count of outstanding futures positions on NSE. Increasing OI means fresh money entering and confirms trend strength; decreasing OI suggests profit booking or position unwinding, so the move lacks fresh commitment. Intraday OI change read against price direction is the fastest gauge of whether institutions back the current SBIN move.
What is long buildup vs short covering in SBIN futures?
Long buildup means SBIN futures price and open interest rise together — fresh longs entering with conviction, the strongest bullish regime. Short covering means price rises while OI falls — existing shorts exiting, a weaker rally that often fades once the covering ends. The chart labels every interval with its regime so you can tell new money from squeezed shorts.
How often does the SBIN futures intraday chart update?
During NSE market hours (9:15 AM to 3:40 PM IST) the SBIN futures intraday table refreshes every minute with the latest futures price and open interest, and you can aggregate rows into 3, 5, or 15-minute intervals. Outside market hours it shows the last traded session, and historical mode replays any past SBIN session.
Which SBIN futures expiry should I track intraday?
Track the near-month SBIN futures contract — it carries the bulk of volume and open interest, so its intraday OI shifts best reflect institutional positioning. In the final week before expiry, also watch the next-month contract: rollover moves OI into it, and falling near-month OI during rollover is routine squaring-off, not genuine unwinding.
Learn more
Read our guide: Long Buildup vs Short Buildup: Reading OI Change with Price