SBIN Futures Price vs OI Analysis Today | Live NSE Data
Master the derivatives market with StockMojo's SBIN Futures Price vs Open Interest (OI) divergence analysis. Our real-time tool tracks the relationship between price action and unsettled contracts to help traders identify high-probability trend reversals and continuation signals.
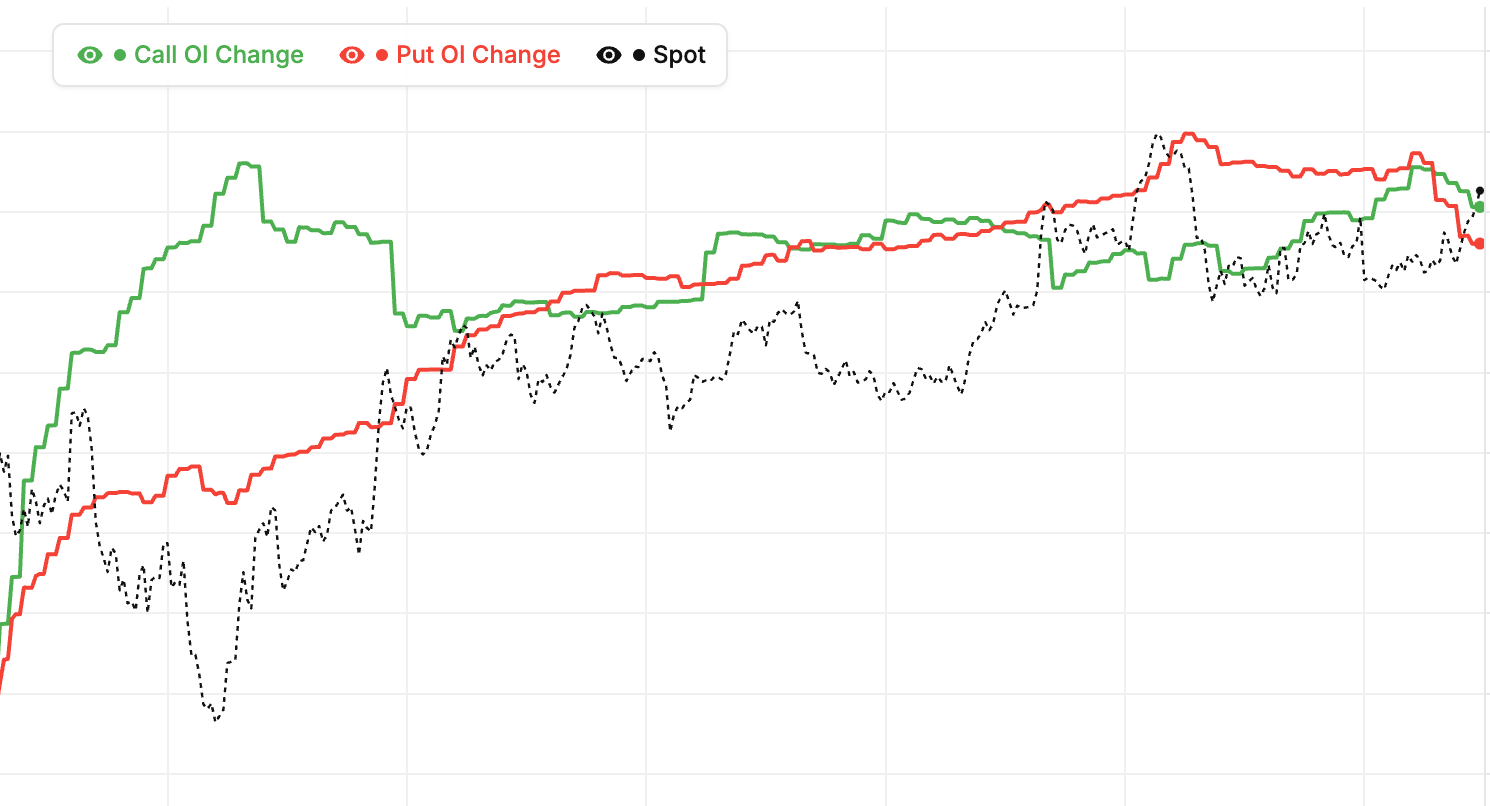
By visualizing SBIN futures price vs OI on a single chart, you can quickly spot buildup patterns: Long Buildup (Price Up, OI Up), Short Buildup (Price Down, OI Up), Short Covering (Price Up, OI Down), and Long Unwinding (Price Down, OI Down). Understanding these four phases of the market cycle is crucial for professional futures and options trading. Analyze intra-day shifts or historical trends to confirm the strength of a price move.
Gain deeper insights into market activity with our Future Intraday Analysis,Smart OI, and Future Heatmap tools.
State Bank of India (SBIN) Future Price vs OI: Divergence Signals
What is a divergence on SBIN?
A divergence happens when State Bank of India futures price and OI move in opposite directions beyond normal variation. Rising price with falling OI = short covering (weak bullish). Falling price with falling OI = long unwinding (weak bearish). These divergences often signal that the current move lacks commitment and may reverse.
Bullish divergence on SBIN
A bullish divergence: price making new lows while OI is rising more slowly or stabilizing. Fresh short positions are not keeping up with the decline. Either shorts are losing conviction or new longs are stepping in. This pattern often precedes a reversal. Prepare for long entries with price confirmation.
Bearish divergence on SBIN
A bearish divergence: price making new highs while OI is rising more slowly or starting to fall. The rally is losing fresh commitment. Either longs are taking profits or shorts are not finding fresh entry points. Prepare for short entries or exit long positions. Divergences appear before reversals, giving you time to act.
Acting on divergences on SBIN as of 13 October 2026
Divergences are leading indicators but need price confirmation before trading. A divergence alone is a warning; combined with a reversal candle or key level break, it becomes a trade signal. Wait for both before entering. Patience for confirmation prevents many false reversal trades.
State Bank of India (SBIN) Future Price vs OI: Volume Integration
Why volume matters alongside SBIN price and OI
Volume is the third essential data point. Price shows direction, OI shows commitment, volume shows engagement. All three together give the most reliable signals. A move backed by all three is high-conviction. Missing any one is a yellow flag for the setup quality.
High-volume SBIN buildups
When Long or Short Buildup happens with above-average volume, the commitment is real. High volume means many participants are actively creating positions. The move has real conviction and typically continues. Enter trades confidently when this combination aligns for State Bank of India.
Low-volume SBIN moves
Moves with low volume are suspect even if OI confirms. Few participants means the move can reverse easily. Wait for better participation before committing capital. Low-volume signals are at best weak confirmations — reduce size or skip.
Triple confirmation on SBIN as of 13 October 2026
The strongest trade setups require price, OI, and volume all agreeing. For example: price breaking resistance + rising OI + high volume = confirmed bullish breakout. These triple-confirmed setups have the highest win rates. Wait for them rather than trading marginal signals that lack full confirmation.
State Bank of India (SBIN) Future Price vs OI: Frequently Asked Questions
What is this tool on SBIN?
The Future Price vs OI tool plots State Bank of India futures price alongside open interest on the same chart. Watching them together reveals buildup patterns, divergences, and trend confirmations. It is an essential tool for active SBIN futures traders who want context beyond pure price action.
How often does it update?
In live mode, the chart updates continuously during NSE market hours. Historical mode shows data for any past trading day. Both modes provide complete price and OI context for analysis, whether for live trading or historical study on State Bank of India.
Is it suitable for beginners on SBIN?
Yes, once you understand the four buildup patterns (Long Buildup, Short Buildup, Long Unwinding, Short Covering). Spend 1-2 weeks observing these patterns on the chart before trading with them. After observation, integration into actual trading decisions becomes natural.
What timeframe works best on SBIN as of 13 October 2026?
The tool works for both intraday and positional analysis. Intraday traders watch patterns throughout the session. Swing and positional traders review end-of-day data. Match frequency to your trading style — the tool adapts to both approaches.
SBIN futures buildup phases: quick reference
| Futures price | Open interest | Phase | Common reading |
|---|---|---|---|
| Rising | Rising | Long buildup | Fresh longs entering SBIN; genuinely bullish, tends to persist |
| Falling | Rising | Short buildup | Fresh shorts entering; genuinely bearish with real conviction |
| Rising | Falling | Short covering | Trapped shorts exiting; sharp but short-lived rally |
| Falling | Falling | Long unwinding | Longs booking out; decline often near exhaustion |
| Moving either way | Flat | No fresh positioning | Low-conviction move; weak base for continuation trades |
| Any | Sharp drop near expiry | Rollover | Positions migrating to the next series; read combined OI instead |
The four buildup phases are read from minute-to-minute changes, so a session can rotate through several phases before settling into one. The live SBIN chart above plots futures price and open interest together and refreshes every minute during NSE market hours, letting you see which phase the contract is trading in right now.
How to read Future Price vs OI
- Pick an underlying — Choose an index (Nifty, BankNifty) for macro positioning or a stock for name-specific flow analysis.
- Classify the current phase — Check whether price and OI are both up (long buildup), both down (long unwinding), or divergent (short buildup or short covering).
- Watch for divergences — Divergences between price and OI are the most tradeable signals — they often mark reversals before price shows them.
- Use first-hour signal — The 9:15-10:15 IST window often sets the day's dominant price-OI pattern. A clear long buildup by 10:30 is high-conviction bullish for the session.
- Plan entry around phase transition — The cleanest entries come at the moment a phase changes — long unwinding flipping to long buildup, or vice versa, is a high-probability reversal setup.
SBIN Futures Price vs OI — Frequently Asked Questions
What is SBIN futures price vs OI?
SBIN futures price vs OI compares price movement with OI changes. Price Up + OI Up = Long Buildup. Price Down + OI Up = Short Buildup. Price Up + OI Down = Short Covering. Price Down + OI Down = Long Unwinding. The phase tells you whether a SBIN move is backed by fresh positions or driven by traders exiting old ones.
How reliable is SBIN futures OI data?
SBIN futures OI is highly reliable for trend confirmation because open interest is exchange-reported data representing actual outstanding contracts — real money committed to the market. Unlike indicators derived from price alone, it cannot be repainted. Its main limitation is expiry week, when rollover activity distorts single-series readings, so read the combined OI across series then.
What does long buildup in SBIN futures mean?
Long buildup in SBIN futures means price is rising while open interest is also rising — fresh long positions are being added with new money. It is the most reliable bullish phase because the up-move is backed by fresh commitment, and it tends to persist for multiple sessions rather than fading like a short-covering rally.
Can SBIN futures price vs OI divergence predict trend reversals?
Yes — divergence between SBIN futures price and open interest is one of the earliest reversal warnings. A rally with falling OI runs on short-covering fuel and usually stalls once shorts finish exiting; a decline with falling OI is long unwinding, often near exhaustion. Combine the divergence with price action at support or resistance before acting.
How often does SBIN futures price vs OI update?
During NSE market hours (9:15 AM to 3:40 PM IST) the SBIN futures price vs OI chart refreshes every minute from live futures contract data. Outside market hours the chart shows the last traded session, and historical mode lets you replay how SBIN price and open interest interacted on any past trading day.
Learn more
Read our guide: Long Buildup vs Short Buildup: Reading OI Change with Price