BANKNIFTY Futures Price vs OI Analysis Today | Live NSE Data
Master the derivatives market with StockMojo's BANKNIFTY Futures Price vs Open Interest (OI) divergence analysis. Our real-time tool tracks the relationship between price action and unsettled contracts to help traders identify high-probability trend reversals and continuation signals.
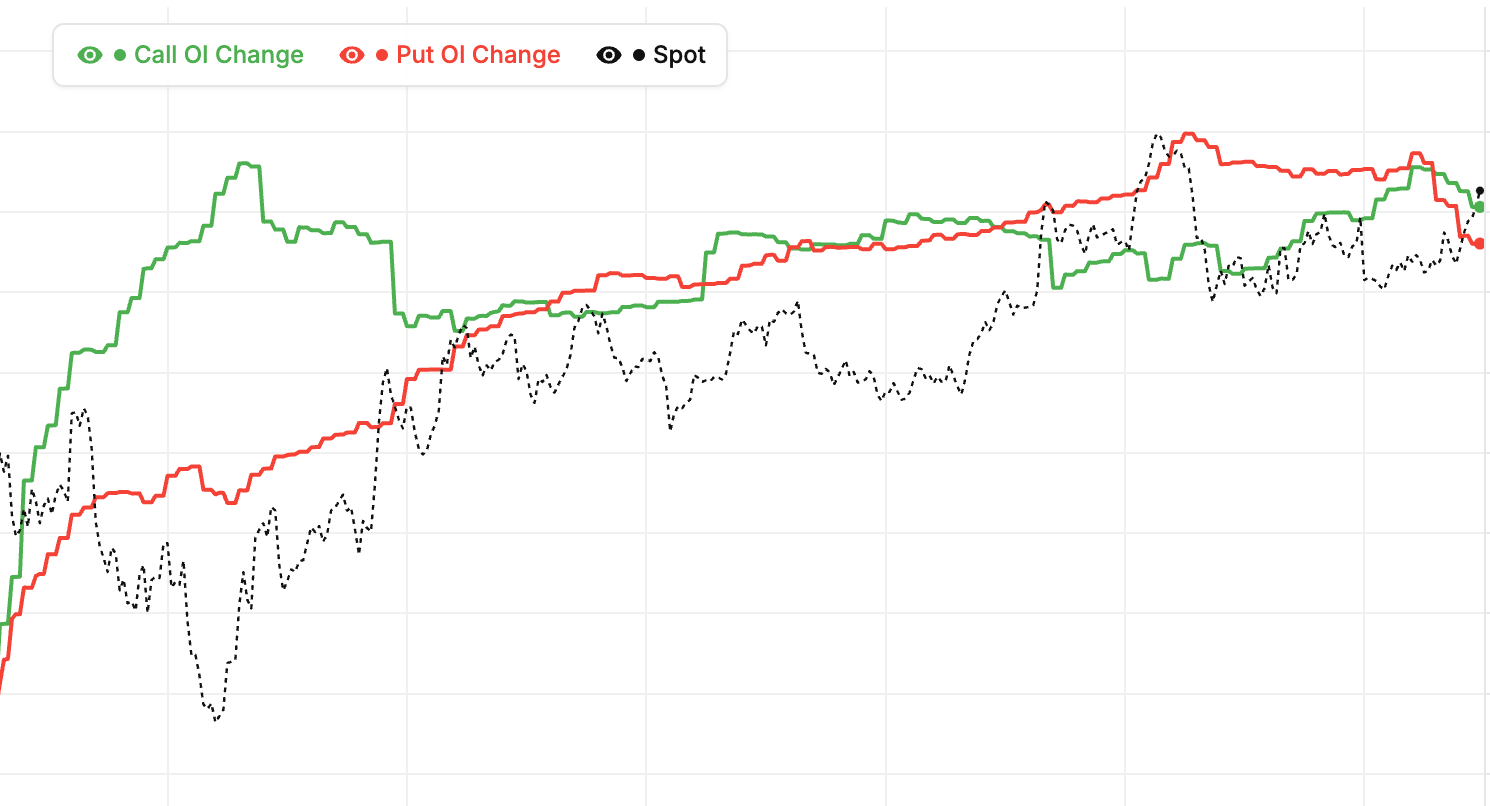
By visualizing BANKNIFTY futures price vs OI on a single chart, you can quickly spot buildup patterns: Long Buildup (Price Up, OI Up), Short Buildup (Price Down, OI Up), Short Covering (Price Up, OI Down), and Long Unwinding (Price Down, OI Down). Understanding these four phases of the market cycle is crucial for professional futures and options trading. Analyze intra-day shifts or historical trends to confirm the strength of a price move.
Gain deeper insights into market activity with our Future Intraday Analysis,Smart OI, and Future Heatmap tools.
Bank Nifty (BANKNIFTY) Future Price vs OI: Risk Management
Why risk management is critical on BANKNIFTY futures
Futures trades are leveraged. Small price moves produce large P&L changes. Without strict risk management, a few bad trades can erase significant capital. Every Bank Nifty futures trader must have rules for position sizing, stops, and losing-trade management.
Position sizing for BANKNIFTY trades
Conservative rule: risk no more than 2% of capital on a single trade. For each setup, calculate the rupee loss if your stop is hit. Size the trade so this potential loss stays within your 2% limit. This discipline ensures survival through inevitable losing streaks.
Stop-loss discipline on BANKNIFTY
Set stops at logical levels — below support for longs, above resistance for shorts. Honour stops strictly. Never remove a stop hoping for a reversal. The emotional pain of a small loss is much smaller than the damage of a runaway loss. Discipline separates professionals from amateurs.
Avoiding averaging down on BANKNIFTY as of 13 October 2026
Adding to a losing position is the fastest path to blow-ups. A losing trade signals your thesis was wrong — compounding the position doubles your exposure to further losses. Exit and find better setups instead. The opportunity cost of patience is far lower than the cost of stubbornness on Bank Nifty.
Bank Nifty (BANKNIFTY) Future Price vs OI: Strategy Examples
Bullish momentum trade on BANKNIFTY
Setup: Bank Nifty futures showing sustained Long Buildup (rising price, rising OI for 3+ days). Technical: price above key moving averages. Volume: above average. All three agree — enter long positions. Stop: recent swing low. Target: next resistance or trailing stop with the trend.
Bearish momentum trade on BANKNIFTY
Setup: Sustained Short Buildup (falling price, rising OI). Technical: price below key moving averages. Volume: above average. Enter short positions. Stop: recent swing high. Target: next support or trailing stop. Follow the trend until the pattern breaks.
Reversal trade on BANKNIFTY
Setup: Sustained trend showing early exhaustion signs — OI stalling while price continues, or divergence between price and OI direction. Technical: price at a major support or resistance. Wait for a reversal candle. Enter in the new direction with a tight stop. Reversals are higher-risk but offer larger rewards when they work.
Range trade on BANKNIFTY as of 13 October 2026
Setup: Price oscillating between clear levels. OI stable — no dominant buildup pattern. Buy near the lower bound with a stop just below. Sell near the upper bound with a stop just above. Close range trades when OI starts trending, signaling a breakout may be imminent.
Bank Nifty (BANKNIFTY) Future Price vs OI: Rollover Patterns
What is rollover on BANKNIFTY futures
Rollover happens as an expiry approaches — traders close positions in the near-month and open them in the next month. The Future Price vs OI chart shows this through declining near-month OI and rising next-month OI. Watching rollover tells you how conviction is being maintained across expiries on Bank Nifty.
High rollover signals on BANKNIFTY
When rollover is high (most OI migrates to the next month), the existing view is being maintained. Bulls stay bullish, bears stay bearish. This conviction usually translates to continued direction in the next expiry cycle. The chart confirms the rollover through the OI transition between expiries.
Low rollover signals on BANKNIFTY
Low rollover means positions are being closed without re-establishment. Traders are uncertain about next month's direction. These periods often precede regime changes or consolidation. Reduce conviction on directional trades when rollover is weak.
Rollover timing on BANKNIFTY as of 13 October 2026
Rollover activity peaks in the final 2-3 sessions before expiry. Watch the chart during this window to see how the next month's OI is building. Is it growing in the same direction as current positioning (maintained view) or shifting (changing view)? These observations guide your positioning for the next cycle.
BANKNIFTY futures buildup phases: quick reference
| Futures price | Open interest | Phase | Common reading |
|---|---|---|---|
| Rising | Rising | Long buildup | Fresh longs entering BANKNIFTY; genuinely bullish, tends to persist |
| Falling | Rising | Short buildup | Fresh shorts entering; genuinely bearish with real conviction |
| Rising | Falling | Short covering | Trapped shorts exiting; sharp but short-lived rally |
| Falling | Falling | Long unwinding | Longs booking out; decline often near exhaustion |
| Moving either way | Flat | No fresh positioning | Low-conviction move; weak base for continuation trades |
| Any | Sharp drop near expiry | Rollover | Positions migrating to the next series; read combined OI instead |
The four buildup phases are read from minute-to-minute changes, so a session can rotate through several phases before settling into one. The live BANKNIFTY chart above plots futures price and open interest together and refreshes every minute during NSE market hours, letting you see which phase the contract is trading in right now.
How to read Future Price vs OI
- Pick an underlying — Choose an index (Nifty, BankNifty) for macro positioning or a stock for name-specific flow analysis.
- Classify the current phase — Check whether price and OI are both up (long buildup), both down (long unwinding), or divergent (short buildup or short covering).
- Watch for divergences — Divergences between price and OI are the most tradeable signals — they often mark reversals before price shows them.
- Use first-hour signal — The 9:15-10:15 IST window often sets the day's dominant price-OI pattern. A clear long buildup by 10:30 is high-conviction bullish for the session.
- Plan entry around phase transition — The cleanest entries come at the moment a phase changes — long unwinding flipping to long buildup, or vice versa, is a high-probability reversal setup.
BANKNIFTY Futures Price vs OI — Frequently Asked Questions
What is BANKNIFTY futures price vs OI?
BANKNIFTY futures price vs OI compares price movement with OI changes. Price Up + OI Up = Long Buildup. Price Down + OI Up = Short Buildup. Price Up + OI Down = Short Covering. Price Down + OI Down = Long Unwinding. The phase tells you whether a BANKNIFTY move is backed by fresh positions or driven by traders exiting old ones.
How reliable is BANKNIFTY futures OI data?
BANKNIFTY futures OI is highly reliable for trend confirmation because open interest is exchange-reported data representing actual outstanding contracts — real money committed to the market. Unlike indicators derived from price alone, it cannot be repainted. Its main limitation is expiry week, when rollover activity distorts single-series readings, so read the combined OI across series then.
What does long buildup in BANKNIFTY futures mean?
Long buildup in BANKNIFTY futures means price is rising while open interest is also rising — fresh long positions are being added with new money. It is the most reliable bullish phase because the up-move is backed by fresh commitment, and it tends to persist for multiple sessions rather than fading like a short-covering rally.
Can BANKNIFTY futures price vs OI divergence predict trend reversals?
Yes — divergence between BANKNIFTY futures price and open interest is one of the earliest reversal warnings. A rally with falling OI runs on short-covering fuel and usually stalls once shorts finish exiting; a decline with falling OI is long unwinding, often near exhaustion. Combine the divergence with price action at support or resistance before acting.
How often does BANKNIFTY futures price vs OI update?
During NSE market hours (9:15 AM to 3:40 PM IST) the BANKNIFTY futures price vs OI chart refreshes every minute from live futures contract data. Outside market hours the chart shows the last traded session, and historical mode lets you replay how BANKNIFTY price and open interest interacted on any past trading day.
Learn more
Read our guide: Long Buildup vs Short Buildup: Reading OI Change with Price