RELIANCE Futures Price vs OI Analysis Today | Live NSE Data
Master the derivatives market with StockMojo's RELIANCE Futures Price vs Open Interest (OI) divergence analysis. Our real-time tool tracks the relationship between price action and unsettled contracts to help traders identify high-probability trend reversals and continuation signals.
By visualizing RELIANCE futures price vs OI on a single chart, you can quickly spot buildup patterns: Long Buildup (Price Up, OI Up), Short Buildup (Price Down, OI Up), Short Covering (Price Up, OI Down), and Long Unwinding (Price Down, OI Down). Understanding these four phases of the market cycle is crucial for professional futures and options trading. Analyze intra-day shifts or historical trends to confirm the strength of a price move.
Gain deeper insights into market activity with our Future Intraday Analysis,Smart OI, and Future Heatmap tools.
Reliance Industries Ltd (RELIANCE) Future Price vs OI: Reading Both Together
What does this chart show for RELIANCE?
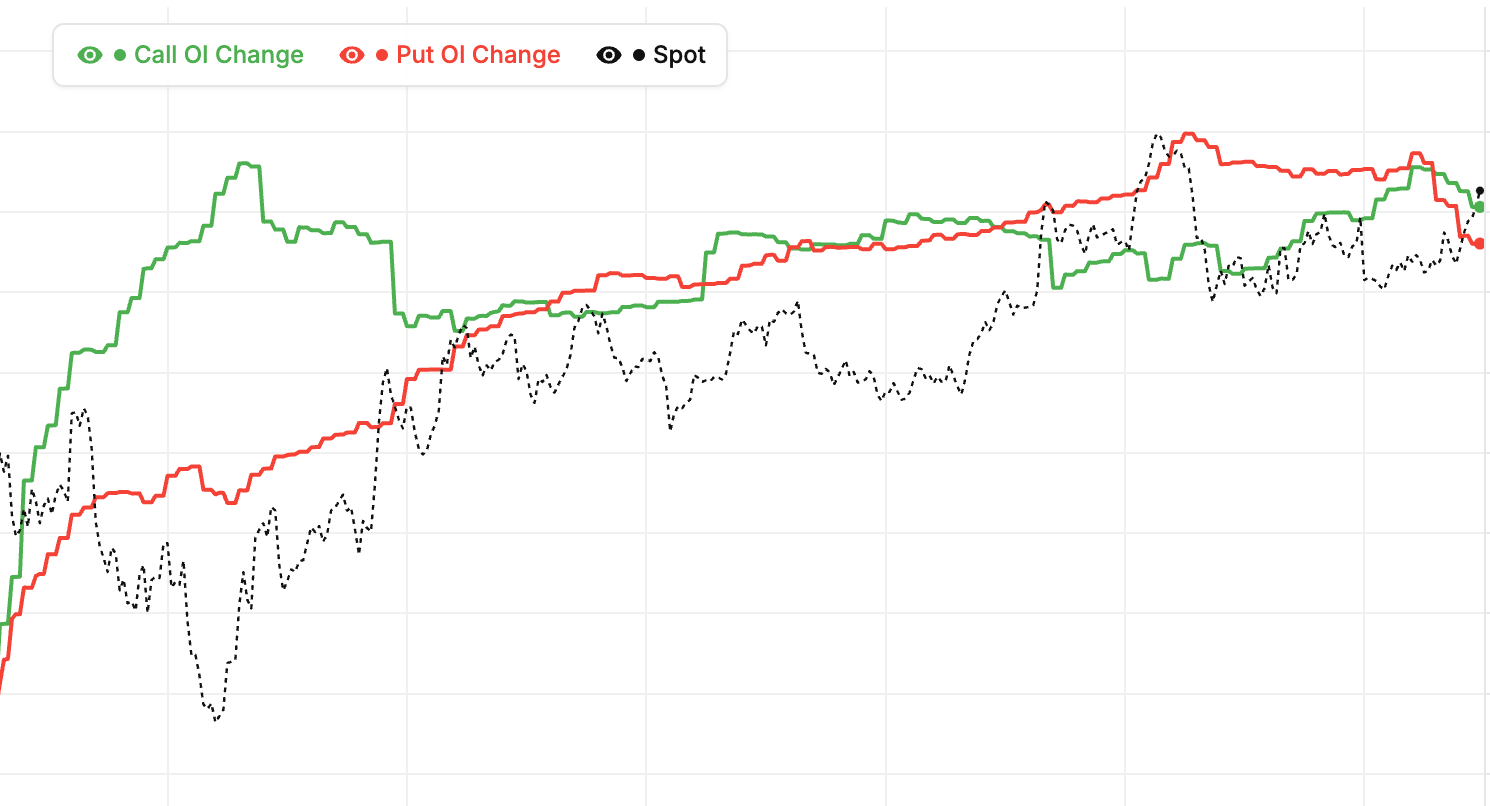
The Future Price vs OI chart for Reliance Industries Ltd (RELIANCE) plots futures price alongside futures open interest on the same chart. Watching them together reveals much more than either alone. Price tells you where the market is going. OI tells you whether the move has conviction. Both together give you the full story of futures positioning.
Why combine RELIANCE price and OI?
Price moves without OI confirmation are often weak — they lack fresh commitment. OI shifts without price moves are early warnings of positioning changes. Only when both move together do you have complete confirmation of market direction. As a NIFTY constituent, Reliance Industries Ltd futures attract enough volume for this combined analysis to be highly actionable.
Starting with the chart today
As of 13 October 2026, open the tool and observe how futures price and OI are moving. Are they in sync or diverging? Is OI rising or falling with current price direction? This simple check in under a minute gives you immediate context for RELIANCE futures trading decisions.
Why serious traders watch both
Institutional traders and professional desks always watch both price and OI together. Retail traders who do the same gain a meaningful edge. It takes only a few extra seconds compared to watching just the price chart, but the added context dramatically improves trade selection on Reliance Industries Ltd.
Reliance Industries Ltd (RELIANCE) Future Price vs OI: Multi-Day Patterns
Why multi-day view matters on RELIANCE
Single-day patterns can be noisy. Multi-day analysis reveals the underlying trend. Look at how Reliance Industries Ltd futures price and OI have moved together over 5-10 sessions. Sustained patterns are much more reliable than one-day observations. This longer view filters out daily noise and reveals real institutional positioning.
5-day buildup trends on RELIANCE
A 5-day Long Buildup trend (price and OI both rising daily) is a strong bullish signal. Fresh longs have been entering consistently. Expect continuation for several more sessions. A 5-day Short Buildup trend is similarly powerful on the bearish side. Multi-day trends give you longer holding periods with higher conviction.
Trend breaks on RELIANCE
When a multi-day trend finally breaks, the reversal is often significant. A 5-day uptrend with sudden OI reversal (Long Unwinding starting) is a warning. Exit longs or consider shorts. These trend break signals give you early exit points before the reversal becomes obvious in price.
Using multi-day analysis as of 13 October 2026
Check the Reliance Industries Ltd chart with a 5-7 day view at the start of each trading week. Identify the dominant pattern. This multi-day view informs your bias for the week. Short-term decisions should respect the multi-day trend unless strong contrary evidence appears.
Reliance Industries Ltd (RELIANCE) Future Price vs OI: Reading Fresh Positioning
What is "fresh positioning" on RELIANCE?
Fresh positioning is when new contracts are being created — OI is rising. This reflects real capital commitment rather than old positions sitting idle. Fresh positioning in any direction is the most actionable signal the chart offers. Stale OI without fresh changes tells you less.
Bullish fresh positioning
A rising Reliance Industries Ltd price with rising OI means fresh longs are entering. This is Long Buildup. The move has genuine commitment. Enter long positions with confidence when you see this pattern persist for at least 2-3 sessions — longer trends are more reliable than single-day patterns.
Bearish fresh positioning
Falling price with rising OI means fresh shorts are entering. Short Buildup. Genuine bearish conviction is building. Enter short positions when you see this sustained pattern. Fresh shorts are fighting the bulls, and their conviction usually pays off as price continues lower.
Filtering stale signals on RELIANCE as of 13 October 2026
High total OI without recent changes is stale positioning from days or weeks ago. Do not base current trades on stale OI. Focus on recent OI changes to identify where fresh commitment is today. The chart shows OI changes alongside totals, making this distinction easy to spot.
RELIANCE futures buildup phases: quick reference
| Futures price | Open interest | Phase | Common reading |
|---|---|---|---|
| Rising | Rising | Long buildup | Fresh longs entering RELIANCE; genuinely bullish, tends to persist |
| Falling | Rising | Short buildup | Fresh shorts entering; genuinely bearish with real conviction |
| Rising | Falling | Short covering | Trapped shorts exiting; sharp but short-lived rally |
| Falling | Falling | Long unwinding | Longs booking out; decline often near exhaustion |
| Moving either way | Flat | No fresh positioning | Low-conviction move; weak base for continuation trades |
| Any | Sharp drop near expiry | Rollover | Positions migrating to the next series; read combined OI instead |
The four buildup phases are read from minute-to-minute changes, so a session can rotate through several phases before settling into one. The live RELIANCE chart above plots futures price and open interest together and refreshes every minute during NSE market hours, letting you see which phase the contract is trading in right now.
How to read Future Price vs OI
- Pick an underlying — Choose an index (Nifty, BankNifty) for macro positioning or a stock for name-specific flow analysis.
- Classify the current phase — Check whether price and OI are both up (long buildup), both down (long unwinding), or divergent (short buildup or short covering).
- Watch for divergences — Divergences between price and OI are the most tradeable signals — they often mark reversals before price shows them.
- Use first-hour signal — The 9:15-10:15 IST window often sets the day's dominant price-OI pattern. A clear long buildup by 10:30 is high-conviction bullish for the session.
- Plan entry around phase transition — The cleanest entries come at the moment a phase changes — long unwinding flipping to long buildup, or vice versa, is a high-probability reversal setup.
RELIANCE Futures Price vs OI — Frequently Asked Questions
What is RELIANCE futures price vs OI?
RELIANCE futures price vs OI compares price movement with OI changes. Price Up + OI Up = Long Buildup. Price Down + OI Up = Short Buildup. Price Up + OI Down = Short Covering. Price Down + OI Down = Long Unwinding. The phase tells you whether a RELIANCE move is backed by fresh positions or driven by traders exiting old ones.
How reliable is RELIANCE futures OI data?
RELIANCE futures OI is highly reliable for trend confirmation because open interest is exchange-reported data representing actual outstanding contracts — real money committed to the market. Unlike indicators derived from price alone, it cannot be repainted. Its main limitation is expiry week, when rollover activity distorts single-series readings, so read the combined OI across series then.
What does long buildup in RELIANCE futures mean?
Long buildup in RELIANCE futures means price is rising while open interest is also rising — fresh long positions are being added with new money. It is the most reliable bullish phase because the up-move is backed by fresh commitment, and it tends to persist for multiple sessions rather than fading like a short-covering rally.
Can RELIANCE futures price vs OI divergence predict trend reversals?
Yes — divergence between RELIANCE futures price and open interest is one of the earliest reversal warnings. A rally with falling OI runs on short-covering fuel and usually stalls once shorts finish exiting; a decline with falling OI is long unwinding, often near exhaustion. Combine the divergence with price action at support or resistance before acting.
How often does RELIANCE futures price vs OI update?
During NSE market hours (9:15 AM to 3:40 PM IST) the RELIANCE futures price vs OI chart refreshes every minute from live futures contract data. Outside market hours the chart shows the last traded session, and historical mode lets you replay how RELIANCE price and open interest interacted on any past trading day.
Learn more
Read our guide: Long Buildup vs Short Buildup: Reading OI Change with Price