RELIANCE Futures Intraday Chart today | Live NSE F&O Data
Analyze RELIANCE futures intraday movements with StockMojo's real-time charting tool. Track live price action, open interest (OI) shifts, and volume spikes on a minute-by-minute basis to stay ahead of market trends.
Our RELIANCE futures terminal provides a comprehensive view of derivative market activity. Monitor institutional positioning and retail participation through high-frequency OI updates. Identify key intra-day levels where buying or selling pressure is building up. Whether you are scalping or swing trading, having access to live RELIANCE future data combined with historical context is essential for managing risk and optimizing entry/exit points.
Complement your intraday research with our Open Interest Analysis,Price vs OI Divergence, and Smart OI tools.
Reliance Industries Ltd (RELIANCE) Future Intraday: Tracking Live Futures Data
What is the RELIANCE Future Intraday tool?
The Future Intraday tool shows live Reliance Industries Ltd (RELIANCE) futures data — price, volume, open interest, and basis — updated in real time during NSE market hours. It is the primary view for active futures traders who need to track conditions minute by minute. The combined view lets you see how all key metrics evolve during the session.
Why futures matter for RELIANCE traders
As a NIFTY constituent, Reliance Industries Ltd futures are often more liquid and responsive than the underlying cash market. Futures traders benefit from leverage, lower transaction costs, and cleaner intraday price action. The tool gives you everything needed to trade RELIANCE futures effectively.
Key data on the chart
The tool displays: futures price (updated tick by tick), cumulative volume, open interest, basis (futures minus spot), and often a summary of how all these have changed. Watching them together reveals the full story of Reliance Industries Ltd futures trading during the session.
Getting started today
As of 13 October 2026, open the tool and observe the futures price, volume, and OI for RELIANCE. How do they compare to yesterday's close? Is fresh positioning happening? These simple observations set your context for making trading decisions throughout the session.
Reliance Industries Ltd (RELIANCE) Future Intraday: Final Hour Dynamics
Why the final hour matters on RELIANCE
The last hour (2:30-3:30 PM) is often the most active and informative part of the Reliance Industries Ltd session. Institutions make end-of-day positioning decisions. Volume picks up. OI shifts reflect next-session expectations. Watching the tool closely during this window provides high-value signals.
Final-hour breakouts on RELIANCE
Breakouts happening in the final hour tend to be more reliable than mid-session moves because institutional participation is higher. If RELIANCE breaks a key level in the last hour with rising volume and OI, the move often carries into the next session. Consider holding overnight if the trend is strong.
End-of-day position decisions
Decide early in the final hour whether you will hold positions overnight or close by 3:30 PM. Holding exposes you to overnight risk but captures continuation. Closing eliminates overnight risk but may miss gains. Match the decision to your risk tolerance and the current setup's strength.
Closing observations on RELIANCE as of 13 October 2026
At 3:30 PM, note the final futures price, volume, and OI changes from the open. These end-of-day stats predict next-session conditions reasonably well. Strong closing positioning often continues into tomorrow's open. Weak closing reverses the pattern. Use this data to plan for the next day.
Reliance Industries Ltd (RELIANCE) Future Intraday: Common Mistakes
Mistake 1: chasing RELIANCE breakouts without confirmation
A price breakout without volume and OI confirmation is often a false move. Many traders chase these breakouts and get trapped when price reverses. Always confirm breakouts with the tool's volume and OI data before entering. Uncomfirmed breakouts are a common trap.
Mistake 2: overtrading mid-session
Mid-session on Reliance Industries Ltd is usually quiet. Overactive traders keep entering marginal setups and accumulating small losses. The best traders stay patient during quiet periods and wait for higher-conviction opportunities in the morning or final hour.
Mistake 3: ignoring overnight risk on RELIANCE
Holding futures positions overnight exposes you to gap risk from global markets or news. Even sound intraday trades can be wiped out by overnight gaps. Decide in advance whether you will hold — do not leave positions open accidentally. Overnight exposure must be a conscious choice.
Mistake 4: no stop-loss discipline as of 13 October 2026
Trading without firm stops is the fastest way to ruin. A single uncontrolled loss can destroy weeks of gains. Always set stops before entering and honour them strictly. The emotional difficulty of taking a small loss is far smaller than the pain of a large one.
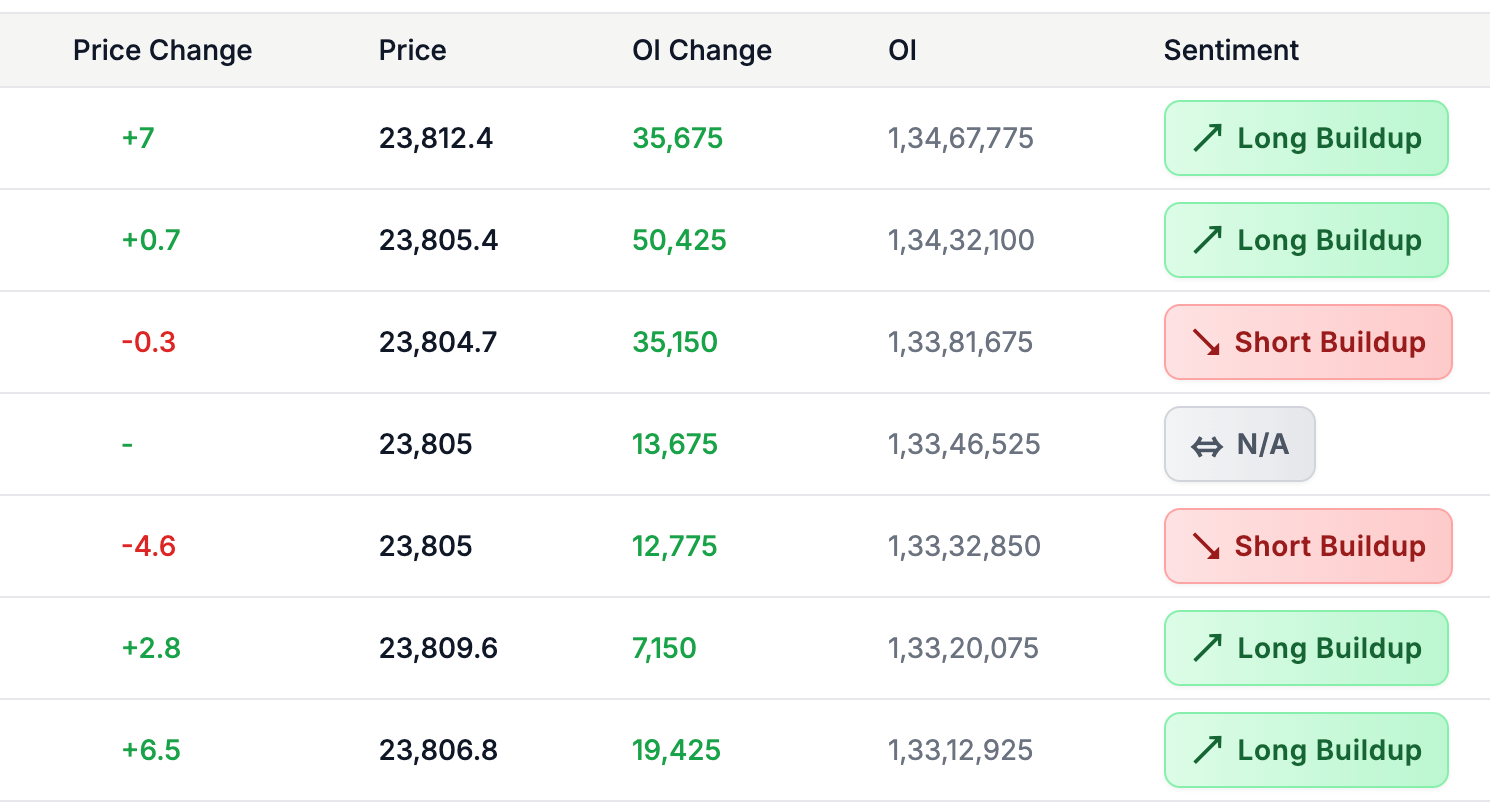
RELIANCE futures price vs OI: quick reference
| Price | Open interest | Regime | Common reading |
|---|---|---|---|
| Rising | Rising | Long buildup | Fresh longs entering; strongest bullish signal on RELIANCE |
| Falling | Rising | Short buildup | Fresh shorts entering; strongest bearish signal |
| Rising | Falling | Short covering | Shorts exiting; weaker rally that often stalls once covering ends |
| Falling | Falling | Long unwinding | Longs exiting without new sellers; weaker bearish signal |
| Flat | Rising | Accumulation | Positions building ahead of a move; watch for the breakout direction |
These four price-OI regimes are the standard NSE futures read: rising-OI moves carry fresh institutional commitment, falling-OI moves are position exits and fade more often. The live RELIANCE table above classifies every 3, 5, or 15-minute interval into one of these regimes, so you can see which side is committing money in real time.
How to use the Future Intraday Chart
- Pick the symbol — Choose Nifty, BankNifty, or any F&O stock. Index futures are the default for most intraday traders.
- Pick the contract month — Near-month is where the volume lives. Switch to next-month if you're studying rollover behaviour around expiry week.
- Read the price and OI lines together — Identify the regime: long buildup, short buildup, short covering, or long unwinding. The colour coding above the chart names it for you.
- Mark the opening-hour reading — Whatever positioning prints between 9:15 and 10:30 IST often dictates the day's bias. Note it.
- Watch the final hour — The 2:30 to 3:30 IST window reveals whether positions are being held overnight or unwound. Carry-forward longs are bullish; aggressive late-day unwinds usually aren't.
RELIANCE Futures Intraday — Frequently Asked Questions
How to track RELIANCE futures intraday?
Track RELIANCE futures intraday by watching the live futures price and open interest together, minute by minute. Rising price with rising OI signals long buildup (bullish conviction); rising price with falling OI signals short covering (a weaker move). StockMojo's chart plots both through the NSE session and classifies each interval automatically.
What is RELIANCE futures OI analysis?
RELIANCE futures OI is the total count of outstanding futures positions on NSE. Increasing OI means fresh money entering and confirms trend strength; decreasing OI suggests profit booking or position unwinding, so the move lacks fresh commitment. Intraday OI change read against price direction is the fastest gauge of whether institutions back the current RELIANCE move.
What is long buildup vs short covering in RELIANCE futures?
Long buildup means RELIANCE futures price and open interest rise together — fresh longs entering with conviction, the strongest bullish regime. Short covering means price rises while OI falls — existing shorts exiting, a weaker rally that often fades once the covering ends. The chart labels every interval with its regime so you can tell new money from squeezed shorts.
How often does the RELIANCE futures intraday chart update?
During NSE market hours (9:15 AM to 3:40 PM IST) the RELIANCE futures intraday table refreshes every minute with the latest futures price and open interest, and you can aggregate rows into 3, 5, or 15-minute intervals. Outside market hours it shows the last traded session, and historical mode replays any past RELIANCE session.
Which RELIANCE futures expiry should I track intraday?
Track the near-month RELIANCE futures contract — it carries the bulk of volume and open interest, so its intraday OI shifts best reflect institutional positioning. In the final week before expiry, also watch the next-month contract: rollover moves OI into it, and falling near-month OI during rollover is routine squaring-off, not genuine unwinding.
Learn more
Read our guide: Long Buildup vs Short Buildup: Reading OI Change with Price