TCS Futures Intraday Chart today | Live NSE F&O Data
Analyze TCS futures intraday movements with StockMojo's real-time charting tool. Track live price action, open interest (OI) shifts, and volume spikes on a minute-by-minute basis to stay ahead of market trends.
Our TCS futures terminal provides a comprehensive view of derivative market activity. Monitor institutional positioning and retail participation through high-frequency OI updates. Identify key intra-day levels where buying or selling pressure is building up. Whether you are scalping or swing trading, having access to live TCS future data combined with historical context is essential for managing risk and optimizing entry/exit points.
Complement your intraday research with our Open Interest Analysis,Price vs OI Divergence, and Smart OI tools.
Tata Consultancy Services Ltd (TCS) Future Intraday: Frequently Asked Questions
What is the TCS Future Intraday tool?
It is a real-time tool showing Tata Consultancy Services Ltd futures price, volume, open interest, and basis during NSE market hours. Data updates minute by minute, letting you monitor conditions as they develop. It is the primary tool for active TCS futures traders.
Is it free to use?
Basic features are free for all users. Premium features (extended historical data, advanced filters, alerts) may require subscription. The core intraday futures analysis is accessible without login on Tata Consultancy Services Ltd.
Can beginners use this tool on TCS?
Yes, with realistic expectations. Beginners should observe before trading. Spend 1-2 weeks watching how futures move alongside options positioning. After this observation period, begin making actual trade decisions with the data as context.
What timeframe is the tool best for on TCS as of 13 October 2026?
The tool is optimized for intraday trading. It works for scalping, day trading, and early swing trade entries. For positional trades lasting weeks, other tools (options chain, longer-timeframe charts) complement the intraday futures view.
Tata Consultancy Services Ltd (TCS) Future Intraday: Buildup Pattern Trading
Trading Long Buildup on TCS
When the Tata Consultancy Services Ltd futures tool shows clear Long Buildup — price and OI rising together — enter long positions with confidence. Fresh bullish money is entering the market. Use the recent swing low as your stop. Target the next resistance level for exit.
Trading Short Buildup on TCS
When Short Buildup appears — price falling with rising OI — enter short positions. Fresh bearish money is entering. Use the recent swing high as your stop. Target the next support level. These trades have high probability because the options market is aligned with the price direction.
Trading Long Unwinding
Long Unwinding (price falling with falling OI) is a weaker bearish signal. Longs are exiting but no fresh shorts are entering. These declines often stall or reverse. Be cautious about shorting into Long Unwinding — prefer Short Buildup for more reliable short setups on TCS.
Trading Short Covering on TCS as of 13 October 2026
Short Covering (price rising with falling OI) is a weaker bullish signal. Shorts are exiting but no fresh longs are entering. The rally lacks commitment. Take profits quickly on existing longs and avoid chasing the move. Wait for Long Buildup for stronger setups.
Tata Consultancy Services Ltd (TCS) Future Intraday: Risk Management
Why risk management is critical on TCS futures
Futures are leveraged instruments. Small moves produce large P&L changes. Without strict risk management, a few losses can wipe out significant capital. Every Tata Consultancy Services Ltd futures trader must have position sizing rules, stop-loss discipline, and a process for managing losing trades.
Position sizing for futures trades
Conservative sizing: never risk more than 2% of trading capital on a single trade. For a standard TCS futures contract, calculate the rupee risk of a stop-loss being hit and make sure it is within your 2% limit. This discipline ensures survival through inevitable losing streaks.
Stop-loss discipline on TCS
Set stops at logical price levels — below key support for longs, above key resistance for shorts. Never remove a stop in hopes of a reversal. If the stop is hit, exit immediately. The discipline to honour stops separates professionals from amateurs. Broken stops usually become bigger losses.
Avoiding averaging down on TCS as of 13 October 2026
Adding to losing positions is the fastest path to large losses. A losing trade means your thesis was wrong — doubling the size doubles the risk. Exit and find a better setup. The opportunity cost of waiting for a better trade is much lower than the cost of a compounding loss.
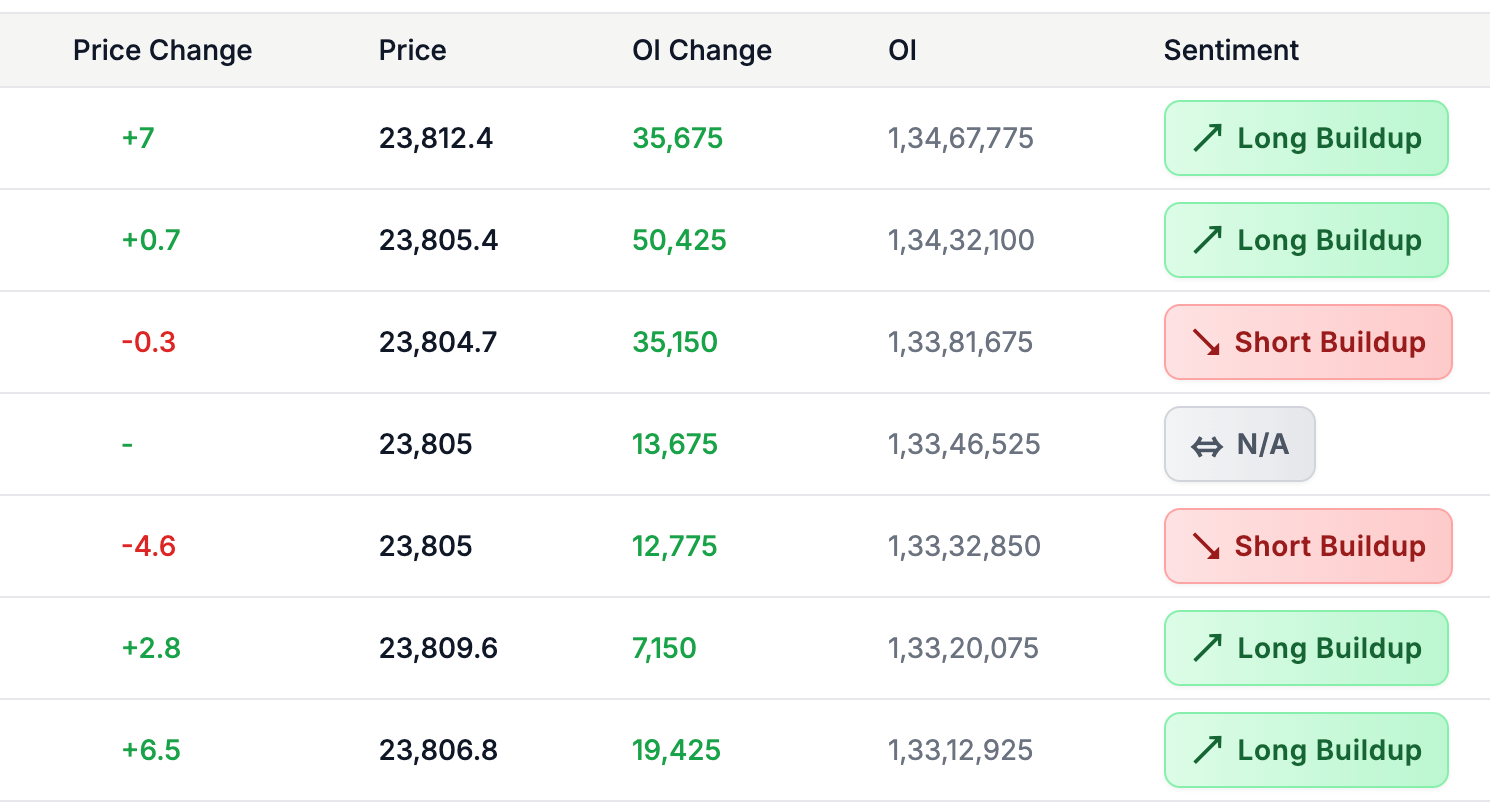
TCS futures price vs OI: quick reference
| Price | Open interest | Regime | Common reading |
|---|---|---|---|
| Rising | Rising | Long buildup | Fresh longs entering; strongest bullish signal on TCS |
| Falling | Rising | Short buildup | Fresh shorts entering; strongest bearish signal |
| Rising | Falling | Short covering | Shorts exiting; weaker rally that often stalls once covering ends |
| Falling | Falling | Long unwinding | Longs exiting without new sellers; weaker bearish signal |
| Flat | Rising | Accumulation | Positions building ahead of a move; watch for the breakout direction |
These four price-OI regimes are the standard NSE futures read: rising-OI moves carry fresh institutional commitment, falling-OI moves are position exits and fade more often. The live TCS table above classifies every 3, 5, or 15-minute interval into one of these regimes, so you can see which side is committing money in real time.
How to use the Future Intraday Chart
- Pick the symbol — Choose Nifty, BankNifty, or any F&O stock. Index futures are the default for most intraday traders.
- Pick the contract month — Near-month is where the volume lives. Switch to next-month if you're studying rollover behaviour around expiry week.
- Read the price and OI lines together — Identify the regime: long buildup, short buildup, short covering, or long unwinding. The colour coding above the chart names it for you.
- Mark the opening-hour reading — Whatever positioning prints between 9:15 and 10:30 IST often dictates the day's bias. Note it.
- Watch the final hour — The 2:30 to 3:30 IST window reveals whether positions are being held overnight or unwound. Carry-forward longs are bullish; aggressive late-day unwinds usually aren't.
TCS Futures Intraday — Frequently Asked Questions
How to track TCS futures intraday?
Track TCS futures intraday by watching the live futures price and open interest together, minute by minute. Rising price with rising OI signals long buildup (bullish conviction); rising price with falling OI signals short covering (a weaker move). StockMojo's chart plots both through the NSE session and classifies each interval automatically.
What is TCS futures OI analysis?
TCS futures OI is the total count of outstanding futures positions on NSE. Increasing OI means fresh money entering and confirms trend strength; decreasing OI suggests profit booking or position unwinding, so the move lacks fresh commitment. Intraday OI change read against price direction is the fastest gauge of whether institutions back the current TCS move.
What is long buildup vs short covering in TCS futures?
Long buildup means TCS futures price and open interest rise together — fresh longs entering with conviction, the strongest bullish regime. Short covering means price rises while OI falls — existing shorts exiting, a weaker rally that often fades once the covering ends. The chart labels every interval with its regime so you can tell new money from squeezed shorts.
How often does the TCS futures intraday chart update?
During NSE market hours (9:15 AM to 3:40 PM IST) the TCS futures intraday table refreshes every minute with the latest futures price and open interest, and you can aggregate rows into 3, 5, or 15-minute intervals. Outside market hours it shows the last traded session, and historical mode replays any past TCS session.
Which TCS futures expiry should I track intraday?
Track the near-month TCS futures contract — it carries the bulk of volume and open interest, so its intraday OI shifts best reflect institutional positioning. In the final week before expiry, also watch the next-month contract: rollover moves OI into it, and falling near-month OI during rollover is routine squaring-off, not genuine unwinding.
Learn more
Read our guide: Long Buildup vs Short Buildup: Reading OI Change with Price