HDFCBANK Futures Intraday Chart today | Live NSE F&O Data
Analyze HDFCBANK futures intraday movements with StockMojo's real-time charting tool. Track live price action, open interest (OI) shifts, and volume spikes on a minute-by-minute basis to stay ahead of market trends.
Our HDFCBANK futures terminal provides a comprehensive view of derivative market activity. Monitor institutional positioning and retail participation through high-frequency OI updates. Identify key intra-day levels where buying or selling pressure is building up. Whether you are scalping or swing trading, having access to live HDFCBANK future data combined with historical context is essential for managing risk and optimizing entry/exit points.
Complement your intraday research with our Open Interest Analysis,Price vs OI Divergence, and Smart OI tools.
HDFC Bank Ltd (HDFCBANK) Future Intraday: Pro Tips
Tip 1: respect the HDFCBANK intraday rhythm
HDFC Bank Ltd futures have rhythms — active opening, quiet mid-session, active close. Trade when the rhythm is favourable. Avoid forcing trades during quiet periods. Respecting the rhythm rather than fighting it produces consistently better results.
Tip 2: combine with options data
Never trade futures in isolation from options data. Options show sentiment and positioning that pure price charts cannot. Use both for every major trade decision on HDFCBANK. The combined view gives you an edge most futures traders lack.
Tip 3: focus on high-conviction setups on HDFCBANK
Selectivity beats frequency. Wait for setups where multiple signals align — price trend, volume confirmation, OI direction, technical levels. High-conviction trades have much better hit rates than random marginal setups. Patience is the highest-value skill.
Tip 4: journal every HDFCBANK trade as of 13 October 2026
Document entry, exit, reason, and outcome for every trade. Over 100 trades, patterns emerge. You see which setups work, which do not, and where your discipline breaks down. This data-driven improvement is the key to long-term success on HDFC Bank Ltd futures.
HDFC Bank Ltd (HDFCBANK) Future Intraday: Technical Integration
Combining futures data with technical analysis
Technical analysis on a HDFC Bank Ltd futures chart identifies levels, trends, and patterns. The futures tool adds the volume and OI context. Together they produce much stronger signals than either alone. A technical breakout confirmed by rising volume and OI has high probability of success.
Support and resistance on HDFCBANK futures
Identify key technical support and resistance on the HDFCBANK futures chart. Then use the tool to check how futures behaved at these levels historically. Levels that repeatedly held or broke with similar OI patterns are reliable for future trades.
Moving averages on HDFCBANK
Common moving averages (20, 50, 200 periods) act as dynamic support and resistance on HDFC Bank Ltd futures. Combine with the volume tool to confirm bounces or breakouts. A bounce from the 50-period MA with rising volume is a strong long signal. A break below the 200-period MA with rising volume is a strong short signal.
Building a complete chart setup as of 13 October 2026
Display: price with moving averages, volume histogram, OI trend, and a few key support/resistance levels. This setup takes 2 minutes to configure and gives you all the key HDFCBANK futures data in one view. Use it as your primary trading interface for active sessions.
HDFC Bank Ltd (HDFCBANK) Future Intraday: Mid-Session Management
Mid-session characteristics on HDFCBANK
From about 11:00 AM to 1:30 PM, HDFC Bank Ltd futures typically see reduced activity. Volume is lower, OI changes are slower, and moves are smaller. This is the "lunch lull" familiar to traders everywhere. Mid-session is often a poor time to initiate new positions because signals are weaker.
Managing open positions
Use mid-session to manage existing positions rather than open new ones. Check that your stops are still appropriate. Take profits on winning trades that have reached targets. Close losing trades that violate stop criteria. The quiet period is ideal for discipline without the pressure of fast markets.
Watching for afternoon setups on HDFCBANK
As 2:00 PM approaches, activity typically picks up. Plan which setups you are looking for in the afternoon. Which levels would trigger entries? What would confirm or invalidate your thesis? The mid-session break lets you think clearly without reacting to every tick.
Mid-session discipline as of 13 October 2026
Many traders lose discipline during quiet periods. Avoid unnecessary trades. Do not enter low-conviction setups just because nothing is happening. The best traders stay patient during dull periods and wait for high-quality opportunities in more active windows on HDFCBANK.
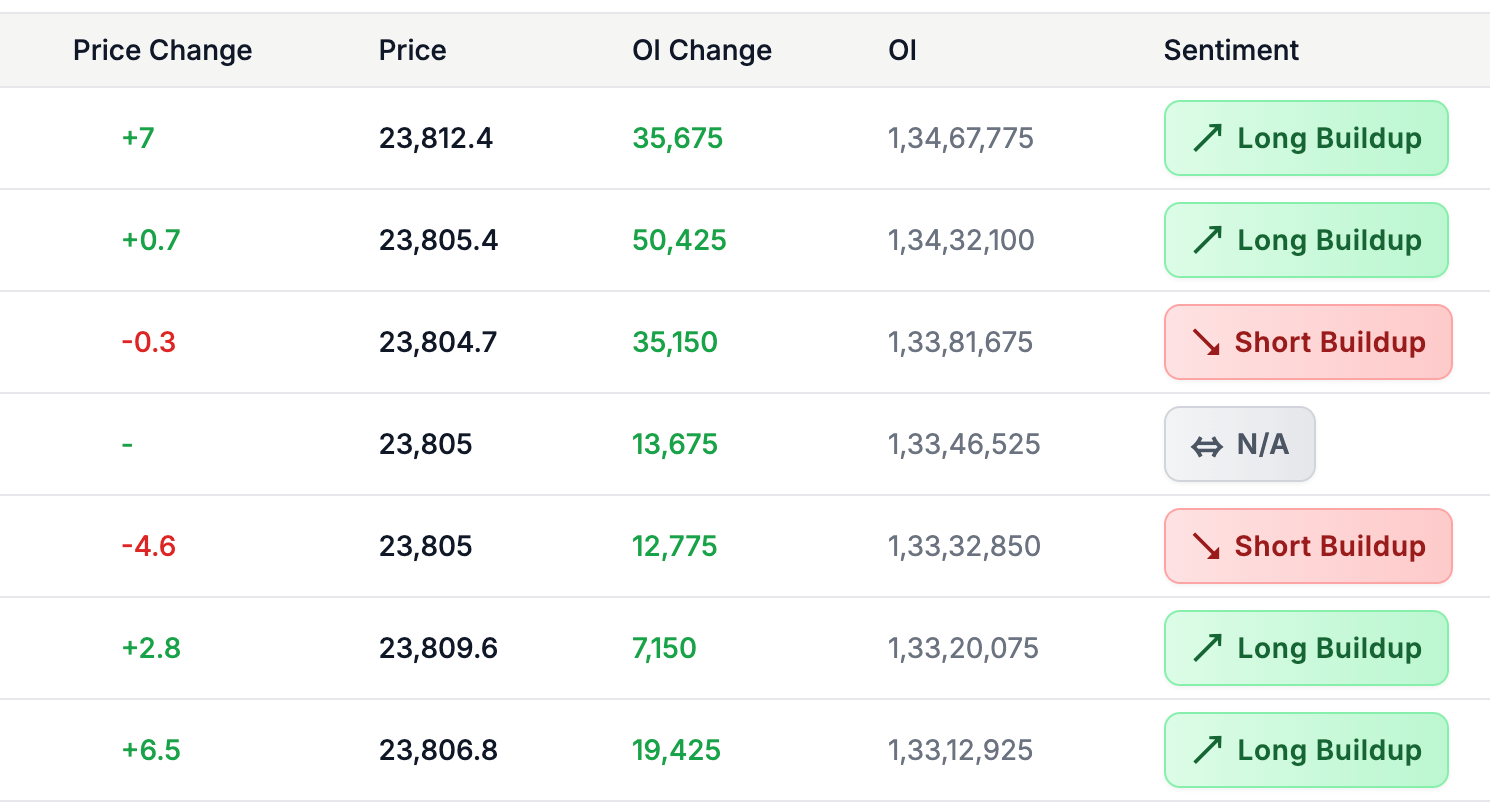
HDFCBANK futures price vs OI: quick reference
| Price | Open interest | Regime | Common reading |
|---|---|---|---|
| Rising | Rising | Long buildup | Fresh longs entering; strongest bullish signal on HDFCBANK |
| Falling | Rising | Short buildup | Fresh shorts entering; strongest bearish signal |
| Rising | Falling | Short covering | Shorts exiting; weaker rally that often stalls once covering ends |
| Falling | Falling | Long unwinding | Longs exiting without new sellers; weaker bearish signal |
| Flat | Rising | Accumulation | Positions building ahead of a move; watch for the breakout direction |
These four price-OI regimes are the standard NSE futures read: rising-OI moves carry fresh institutional commitment, falling-OI moves are position exits and fade more often. The live HDFCBANK table above classifies every 3, 5, or 15-minute interval into one of these regimes, so you can see which side is committing money in real time.
How to use the Future Intraday Chart
- Pick the symbol — Choose Nifty, BankNifty, or any F&O stock. Index futures are the default for most intraday traders.
- Pick the contract month — Near-month is where the volume lives. Switch to next-month if you're studying rollover behaviour around expiry week.
- Read the price and OI lines together — Identify the regime: long buildup, short buildup, short covering, or long unwinding. The colour coding above the chart names it for you.
- Mark the opening-hour reading — Whatever positioning prints between 9:15 and 10:30 IST often dictates the day's bias. Note it.
- Watch the final hour — The 2:30 to 3:30 IST window reveals whether positions are being held overnight or unwound. Carry-forward longs are bullish; aggressive late-day unwinds usually aren't.
HDFCBANK Futures Intraday — Frequently Asked Questions
How to track HDFCBANK futures intraday?
Track HDFCBANK futures intraday by watching the live futures price and open interest together, minute by minute. Rising price with rising OI signals long buildup (bullish conviction); rising price with falling OI signals short covering (a weaker move). StockMojo's chart plots both through the NSE session and classifies each interval automatically.
What is HDFCBANK futures OI analysis?
HDFCBANK futures OI is the total count of outstanding futures positions on NSE. Increasing OI means fresh money entering and confirms trend strength; decreasing OI suggests profit booking or position unwinding, so the move lacks fresh commitment. Intraday OI change read against price direction is the fastest gauge of whether institutions back the current HDFCBANK move.
What is long buildup vs short covering in HDFCBANK futures?
Long buildup means HDFCBANK futures price and open interest rise together — fresh longs entering with conviction, the strongest bullish regime. Short covering means price rises while OI falls — existing shorts exiting, a weaker rally that often fades once the covering ends. The chart labels every interval with its regime so you can tell new money from squeezed shorts.
How often does the HDFCBANK futures intraday chart update?
During NSE market hours (9:15 AM to 3:40 PM IST) the HDFCBANK futures intraday table refreshes every minute with the latest futures price and open interest, and you can aggregate rows into 3, 5, or 15-minute intervals. Outside market hours it shows the last traded session, and historical mode replays any past HDFCBANK session.
Which HDFCBANK futures expiry should I track intraday?
Track the near-month HDFCBANK futures contract — it carries the bulk of volume and open interest, so its intraday OI shifts best reflect institutional positioning. In the final week before expiry, also watch the next-month contract: rollover moves OI into it, and falling near-month OI during rollover is routine squaring-off, not genuine unwinding.
Learn more
Read our guide: Long Buildup vs Short Buildup: Reading OI Change with Price