SENSEX Futures Intraday Chart today | Live NSE F&O Data
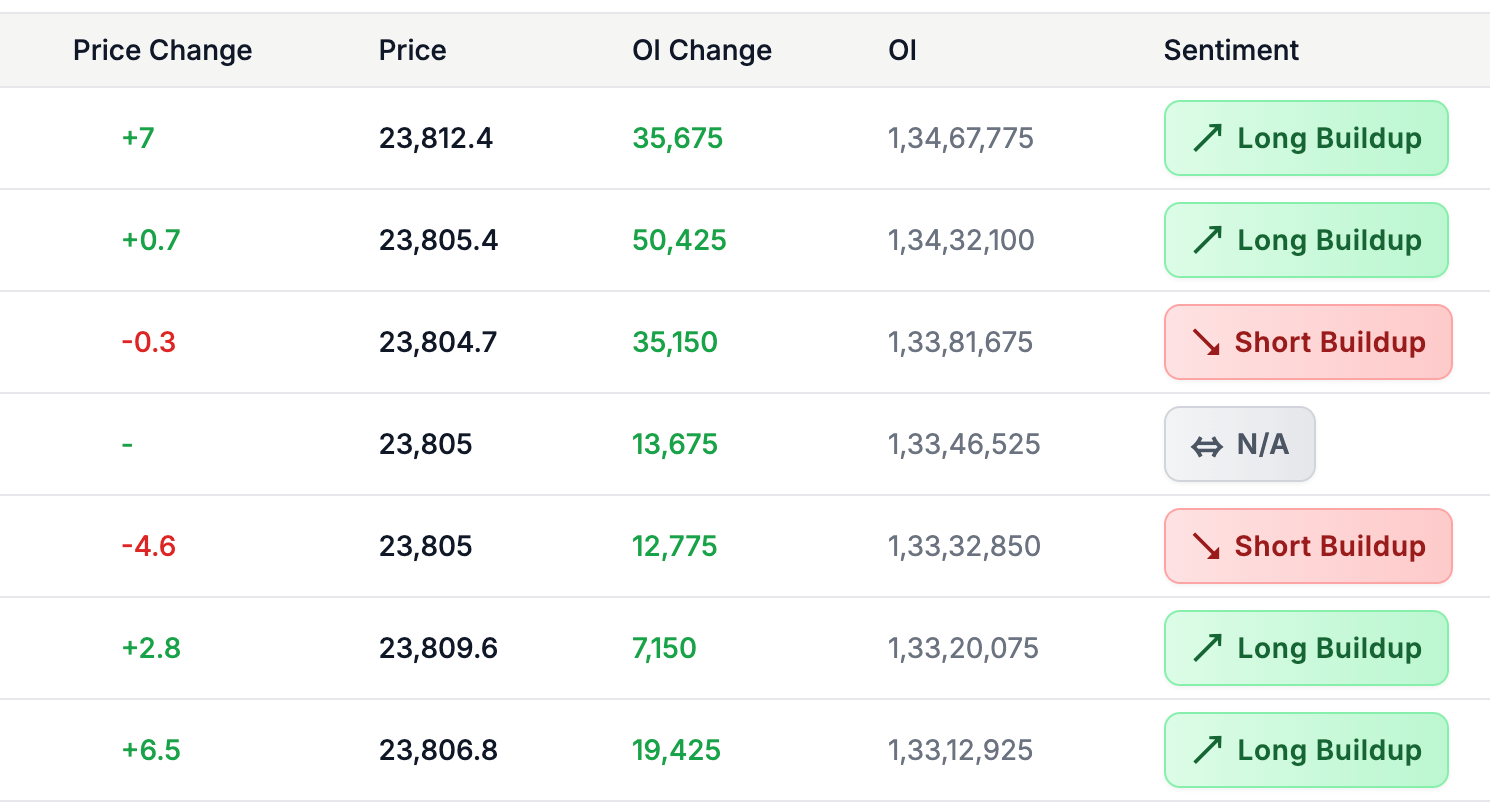
Analyze SENSEX futures intraday movements with StockMojo's real-time charting tool. Track live price action, open interest (OI) shifts, and volume spikes on a minute-by-minute basis to stay ahead of market trends.
Our SENSEX futures terminal provides a comprehensive view of derivative market activity. Monitor institutional positioning and retail participation through high-frequency OI updates. Identify key intra-day levels where buying or selling pressure is building up. Whether you are scalping or swing trading, having access to live SENSEX future data combined with historical context is essential for managing risk and optimizing entry/exit points.
Complement your intraday research with our Open Interest Analysis,Price vs OI Divergence, and Smart OI tools.
BSE Sensex (SENSEX) Future Intraday: Historical Mode
Why replay historical SENSEX data
Historical mode lets you review BSE Sensex futures from any past trading day. You see how price, volume, OI, and basis moved together during that session. This retrospective view builds pattern recognition faster than live trading because you can study many sessions quickly.
Study routine for SENSEX
Each weekend, pick 2-3 significant past sessions (big up days, big down days, range days). Replay them in historical mode. Note how the patterns unfolded. Which setups gave early warning? What was the OI pattern? These observations build intuition that raw theory cannot provide.
Comparing similar days on SENSEX
Historical mode lets you compare recent Tuesdays, Wednesdays, or expiry days. Patterns often repeat on similar days of the week or expiry cycle. Recognising these repeating patterns gives you an edge when the same type of day arrives again.
Learning from losses on SENSEX as of 13 October 2026
Your past losing trades on BSE Sensex are valuable data. Replay those sessions in historical mode. What signals did you miss? Was the setup actually weak? Did you ignore a divergence? Learning from losses through historical review is one of the fastest ways to improve.
BSE Sensex (SENSEX) Future Intraday: Reading the Basis
What is futures basis on SENSEX?
Basis is the difference between the BSE Sensex futures price and the underlying spot price. Positive basis means futures trade above spot (contango). Negative basis means below (backwardation). The basis reflects cost of carry, dividends, and market sentiment about the coming month for SENSEX.
Normal basis behaviour
For BSE Sensex, basis is usually slightly positive — futures cost a little more than spot because of the cost of holding long positions. As expiry approaches, the basis shrinks toward zero (convergence). Watching the basis daily tells you whether current conditions are normal or unusual.
When basis is unusual on SENSEX
An unusually large positive basis signals aggressive buying in futures — possibly bullish conviction. An unusually negative basis (backwardation) signals aggressive selling in futures — possibly bearish conviction or arbitrage dynamics. Both extremes are informational signals worth acting on.
Using basis on SENSEX as of 13 October 2026
Check the basis at the start of each session. Is it widening or narrowing? Is it unusual compared to recent sessions? These observations add a layer of intelligence to your futures trading. Widening basis in the morning often signals a trending day; narrowing signals consolidation.
BSE Sensex (SENSEX) Future Intraday: Trend Trading
Identifying SENSEX trends
A trend on BSE Sensex futures is a sustained directional move with higher highs or lower lows. The tool confirms trends through rising OI in the trend direction and supporting volume. Trends can last hours, days, or weeks. Catching them early and riding them produces some of the highest returns for futures traders.
Trend confirmation on SENSEX
A confirmed trend shows: consistent price direction, rising OI (fresh participation), and above-average volume. All three aligned signal a trend worth trading with the direction. Fighting a confirmed trend is a losing proposition — align with it rather than against.
Trend exhaustion signs
Trends end eventually. Watch for warning signs: OI stops rising while price continues (no fresh commitment), volume declining (participants losing interest), or divergences between price and indicators. These warnings often appear before the reversal becomes obvious in price.
Trading a SENSEX trend as of 13 October 2026
Enter in the trend direction on pullbacks (buying dips in uptrends, selling rallies in downtrends). Use trailing stops to stay in the trade as long as the trend continues. Exit when the trend shows clear exhaustion signs. Let winners run — trend trades produce their biggest profits through patience.
SENSEX futures price vs OI: quick reference
| Price | Open interest | Regime | Common reading |
|---|---|---|---|
| Rising | Rising | Long buildup | Fresh longs entering; strongest bullish signal on SENSEX |
| Falling | Rising | Short buildup | Fresh shorts entering; strongest bearish signal |
| Rising | Falling | Short covering | Shorts exiting; weaker rally that often stalls once covering ends |
| Falling | Falling | Long unwinding | Longs exiting without new sellers; weaker bearish signal |
| Flat | Rising | Accumulation | Positions building ahead of a move; watch for the breakout direction |
These four price-OI regimes are the standard NSE futures read: rising-OI moves carry fresh institutional commitment, falling-OI moves are position exits and fade more often. The live SENSEX table above classifies every 3, 5, or 15-minute interval into one of these regimes, so you can see which side is committing money in real time.
How to use the Future Intraday Chart
- Pick the symbol — Choose Nifty, BankNifty, or any F&O stock. Index futures are the default for most intraday traders.
- Pick the contract month — Near-month is where the volume lives. Switch to next-month if you're studying rollover behaviour around expiry week.
- Read the price and OI lines together — Identify the regime: long buildup, short buildup, short covering, or long unwinding. The colour coding above the chart names it for you.
- Mark the opening-hour reading — Whatever positioning prints between 9:15 and 10:30 IST often dictates the day's bias. Note it.
- Watch the final hour — The 2:30 to 3:30 IST window reveals whether positions are being held overnight or unwound. Carry-forward longs are bullish; aggressive late-day unwinds usually aren't.
SENSEX Futures Intraday — Frequently Asked Questions
How to track SENSEX futures intraday?
Track SENSEX futures intraday by watching the live futures price and open interest together, minute by minute. Rising price with rising OI signals long buildup (bullish conviction); rising price with falling OI signals short covering (a weaker move). StockMojo's chart plots both through the NSE session and classifies each interval automatically.
What is SENSEX futures OI analysis?
SENSEX futures OI is the total count of outstanding futures positions on NSE. Increasing OI means fresh money entering and confirms trend strength; decreasing OI suggests profit booking or position unwinding, so the move lacks fresh commitment. Intraday OI change read against price direction is the fastest gauge of whether institutions back the current SENSEX move.
What is long buildup vs short covering in SENSEX futures?
Long buildup means SENSEX futures price and open interest rise together — fresh longs entering with conviction, the strongest bullish regime. Short covering means price rises while OI falls — existing shorts exiting, a weaker rally that often fades once the covering ends. The chart labels every interval with its regime so you can tell new money from squeezed shorts.
How often does the SENSEX futures intraday chart update?
During NSE market hours (9:15 AM to 3:40 PM IST) the SENSEX futures intraday table refreshes every minute with the latest futures price and open interest, and you can aggregate rows into 3, 5, or 15-minute intervals. Outside market hours it shows the last traded session, and historical mode replays any past SENSEX session.
Which SENSEX futures expiry should I track intraday?
Track the near-month SENSEX futures contract — it carries the bulk of volume and open interest, so its intraday OI shifts best reflect institutional positioning. In the final week before expiry, also watch the next-month contract: rollover moves OI into it, and falling near-month OI during rollover is routine squaring-off, not genuine unwinding.
Learn more
Read our guide: Long Buildup vs Short Buildup: Reading OI Change with Price