SENSEX Premium Decay Analysis (Live)
Track real-time premium decay (theta decay) for SENSEX options. Premium decay is the erosion of an option's extrinsic value purely from the passage of time, and it drives the daily loss that SENSEX option buyers pay and option sellers collect. The chart plots Call and Put premium minute by minute so you can watch the decay slope steepen as expiry approaches.
Decay is non-linear: a far-dated SENSEX option loses very little per day, but the same option loses several times more per day in its final week and can shed the bulk of its remaining premium on expiry day. Sellers harvest this theta with short straddles, strangles, and credit spreads; buyers must overcome it with a quick, large directional move in SENSEX. Historical mode lets you replay the decay curve for any past SENSEX expiry to study how premium behaved around results, RBI policy, or major global events.
Pair premium decay with the Straddle Chart for the combined call-plus-put expected move, the IV Chart to see the volatility component that inflates or crushes premium beyond pure theta, and the Option Chain for live per-strike Greeks including theta.
BSE Sensex (SENSEX) Premium Decay: Live vs Historical Mode
What does live decay mode show for SENSEX?
Live mode displays BSE Sensex premium values updating in real time during NSE market hours. You see decay happening minute by minute as prices adjust and time passes. This real-time view is essential for active traders managing premium-selling or buying positions on SENSEX.
Why use historical decay mode?
Historical mode lets you replay decay patterns from any past trading day. This is valuable for studying how decay unfolded during specific market conditions — calm days, event days, and expiry days. Historical replay builds pattern recognition that helps you anticipate decay in live trading.
Comparing SENSEX decay across similar days
Pull up the decay chart for a few recent Tuesdays of expiry week. How did decay unfold? Was it steady or event-driven? Did certain strikes decay faster than expected? These comparisons across similar days reveal consistent patterns you can use for your live trades.
Building a SENSEX decay playbook as of 26 July 2026
Over weeks of studying historical decay data, compile notes on what you observed. Normal decay rates by day of the week. Decay acceleration points. Event-day disruptions. These notes become your personal playbook for BSE Sensex premium trades, far more useful than any generic guide.
BSE Sensex (SENSEX) Premium Decay: Pro Tips
Tip 1: respect the theta curve
Theta accelerates as expiry approaches. Plan your entries and exits around this curve. Sellers maximize gains late in the cycle. Buyers minimize losses by exiting before the steep part. The BSE Sensex decay chart visualises the curve for every strike you care about.
Tip 2: combine decay with IV context
Decay without IV awareness is incomplete. Check whether IV is rising or falling on the IV chart before selling premium. Rising IV offsets theta and can turn winning sellers into losers. Always check both before entering premium trades.
Tip 3: stick to defined-risk structures on SENSEX
Naked shorts look attractive because of higher potential profit but the tail risk is real. Iron condors and credit spreads limit your worst case. For most traders, the smaller profit is worth the peace of mind and survival guarantee.
Tip 4: journal every SENSEX decay trade as of 26 July 2026
Note entry, exit, theta captured, and outcome. Over 100 trades, patterns emerge. You see which strikes work best, which days of the week are best, which market conditions favour your approach. This data-driven improvement is what separates amateur and professional premium sellers on BSE Sensex.
BSE Sensex (SENSEX) Premium Decay: Multi-Expiry Comparison
Why compare SENSEX decay across expiries
BSE Sensex has weekly and monthly expiries. Each has its own decay curve. Weekly decay is faster because there is less total time. Monthly decay is slower but over more days. Comparing both tells you which expiry offers better theta per day for your strategy.
Weekly expiry decay on SENSEX
Weekly SENSEX options decay rapidly. An ATM weekly option can lose 15-25% of value per day in the last few sessions. This fast decay is attractive for sellers but punishing for buyers. Weekly options are best for short-duration, high-conviction directional plays.
Monthly expiry decay on SENSEX
Monthly options decay more slowly. Daily theta is smaller, giving buyers more forgiveness for timing. But the total premium is larger, so the absolute rupee loss per day is also meaningful. Monthly options suit swing and positional traders better than scalpers.
Picking the right expiry as of 26 July 2026
Match the expiry to your holding period. If you will hold 1-3 days, weekly is fine. 1-2 weeks, monthly is better. For sellers, weeklies capture more theta per session but with higher gamma risk. Monthlies capture less per session but over more sessions. Both have their place.
Premium Decay & Theta Analysis - NIFTY
Expert insights into NIFTY option price erosion, time value decay, and trading strategies • Real-time Data
Premium decay, also known as Theta decay, is the rate at which a NIFTY option's extrinsic value decreases as it approaches its expiration date. Options lose time value every day, causing their premiums to erode. This decay accelerates rapidly in the final days and hours before expiry.
Understanding premium decay is critical for NIFTY options traders:
• For Option Buyers: Time is your enemy. You need NIFTY to move significantly and quickly in your favor to overcome the daily loss of time value (theta). Buying OTM options close to expiry carries extreme decay risk.
• For Option Sellers (Writers): Time is your friend. Sellers profit from NIFTY options slowly losing value over time, even if the market remains completely flat.
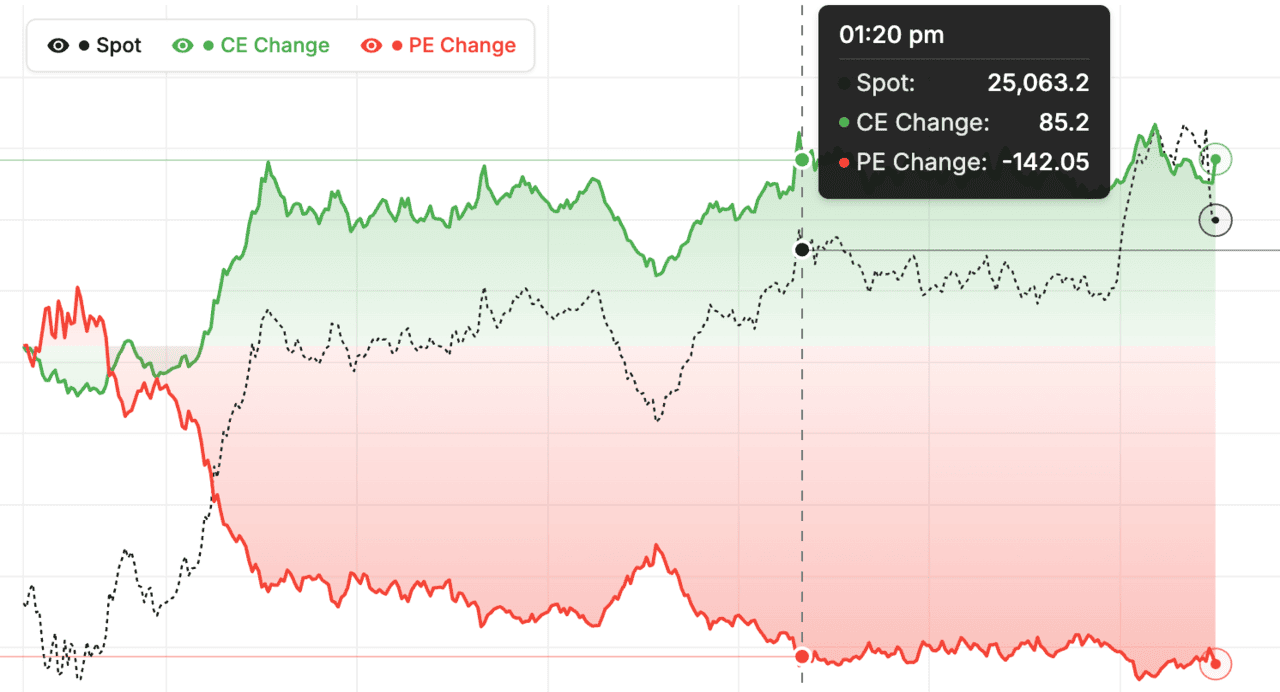
The NIFTY Premium Decay Chart helps visualize how Call and Put premiums are eroding intraday.
1. High Put Premium Decay: If Put options are rapidly losing value while Calls hold steady or rise, it indicates bullish sentiment.
2. High Call Premium Decay: If Call options are losing value faster than Puts, it suggests bearish sentiment.
3. Identifying Sideways Markets: When both Call and Put premiums decay symmetrically, NIFTY is likely range-bound or consolidating.
Premium Decay Change shows the net change in premium value from the market open, making it easy to spot intraday trends and momentum shifts in NIFTY options.
Total Premium (Call vs Put) displays the absolute premium values at any given time, which is useful to compare overall positioning and find out which side (Calls or Puts) is commanding higher premiums.
For a comprehensive options analysis of NIFTY, combine this tool with:
Track ATM Straddle premiums to spot volatility crush or expansion.
Understand the broader options market sentiment via PCR trends.
Check real-time Greeks including Theta values for specific strikes.
SENSEX premium decay: quick reference
| Time to expiry | Decay pace (theta) | For buyers | For sellers |
|---|---|---|---|
| Far — over 20 days | Slow and steady | Cheap time drag; room to be right | Little premium banked per day |
| Mid — 7 to 20 days | Moderate, building | Decay manageable; trend trades viable | Steady theta income begins |
| Near — 2 to 6 days | Fast, accelerating | Gains erode quickly; need prompt moves | Prime theta-harvesting window |
| Expiry eve — 1 day | Very fast | Only sharp moves overcome decay | Rich decay, but gamma risk climbs |
| Expiry day — 0 days | Extreme, intraday collapse | OTM premium can vanish by close | Maximum theta and maximum gamma risk |
Because SENSEX theta accelerates non-linearly, the same option loses far more value in its final days than in its first. Buyers pay this decay every session and need quick, directional moves; sellers harvest it and lean on the near-expiry buckets. The live chart above shows the actual slope, so you can see which decay regime SENSEX is trading in right now.
How to use the Premium Decay tool
- Pick a symbol, strike, and expiry — Choose your underlying, the strike you want to analyze, and the expiry. Most traders watch ATM ± 1 strike.
- Read the decay curve — Note the current premium and how it has decayed since the start of the session or since the option was first listed.
- Compare ATM vs OTM strikes — Switch between strikes to see how decay differs across the moneyness range. ATM decay is fastest in absolute terms.
- Plan your entry around theta — Use the steepest part of the decay curve as a guide for when to enter short-premium positions and when to exit.
- Cross-reference with the Straddle Chart — Open the Straddle Chart alongside Premium Decay for a combined view of single-leg theta and combined-leg expected move.
SENSEX Premium Decay — Frequently Asked Questions
How fast does SENSEX premium decay accelerate near expiry?
SENSEX premium decay is non-linear and accelerates sharply as expiry nears, because time value shrinks roughly in proportion to the square root of the time left. A weekly at-the-money option that sheds a few rupees a day early in its life can lose 40-60% of its value on expiry day, with the steepest erosion in the final trading hours.
How does SENSEX premium decay differ for ATM, ITM, and OTM options?
At-the-money SENSEX options carry the most extrinsic value, so they show the largest absolute theta decay. In-the-money options are mostly intrinsic value and decay slowly. Deep out-of-the-money options have little premium to lose and drift down gradually until they collapse toward zero in the final hours of expiry day.
Why does implied volatility change the SENSEX premium decay rate?
Higher implied volatility inflates the extrinsic value of SENSEX options, so there is more premium available to decay away each day. A high-IV option loses more rupees per day to theta than a low-IV option with the same expiry. This is why premium sellers prefer to write SENSEX options when IV is elevated.
When does the SENSEX premium decay chart update?
During NSE market hours (9:15 AM to 3:30 PM IST) the SENSEX premium decay chart streams live over WebSocket and refreshes every minute as option prices tick. Outside market hours it shows the last completed session, and historical mode lets you replay premium decay for any past SENSEX expiry.
How do option sellers profit from SENSEX premium decay?
Sellers collect SENSEX option premium upfront and keep the portion that theta erodes each day the position stays open. Selling closer to expiry captures faster decay. Short straddles, strangles, iron condors, and credit spreads all monetize this erosion — the trade-off is gamma risk if SENSEX makes a sharp, sudden move.