FINNIFTY Premium Decay Analysis (Live)
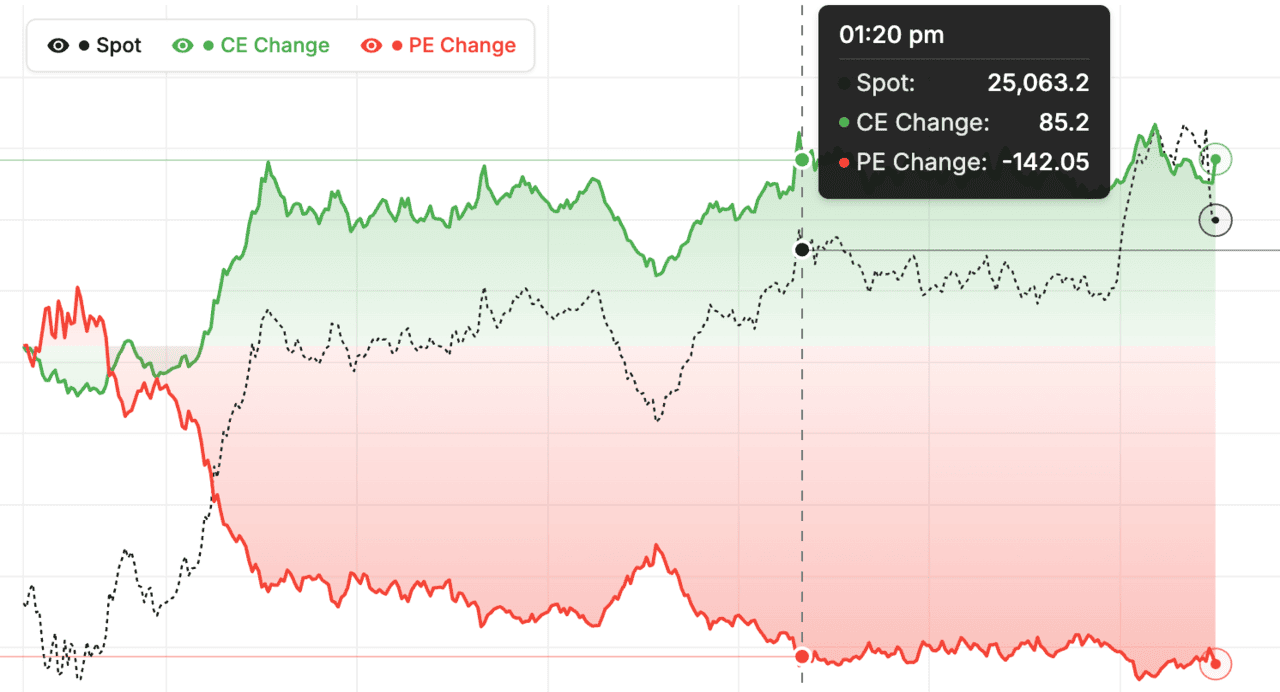
Track real-time premium decay (theta decay) for FINNIFTY options. Premium decay is the erosion of an option's extrinsic value purely from the passage of time, and it drives the daily loss that FINNIFTY option buyers pay and option sellers collect. The chart plots Call and Put premium minute by minute so you can watch the decay slope steepen as expiry approaches.
Decay is non-linear: a far-dated FINNIFTY option loses very little per day, but the same option loses several times more per day in its final week and can shed the bulk of its remaining premium on expiry day. Sellers harvest this theta with short straddles, strangles, and credit spreads; buyers must overcome it with a quick, large directional move in FINNIFTY. Historical mode lets you replay the decay curve for any past FINNIFTY expiry to study how premium behaved around results, RBI policy, or major global events.
Pair premium decay with the Straddle Chart for the combined call-plus-put expected move, the IV Chart to see the volatility component that inflates or crushes premium beyond pure theta, and the Option Chain for live per-strike Greeks including theta.
Nifty Financial Services (FINNIFTY) Premium Decay: The Theta Curve
What is the theta curve?
The theta curve is how time decay changes as expiry approaches. Early in the expiry cycle, decay is slow and steady. Mid-cycle, it accelerates. In the final week, decay becomes dramatic. The curve is not linear — it is exponential. This acceleration pattern is one of the most important features of the Nifty Financial Services decay chart.
Early-cycle decay on FINNIFTY
In the first half of a monthly expiry, FINNIFTY ATM options lose a small fraction of their value each day — typically 1-3%. This slow decay gives buyers time to be right on direction before time erodes their capital. During this period, long premium strategies are most viable.
Mid-cycle acceleration on FINNIFTY
In the middle of the cycle, decay accelerates. Daily losses become larger — 3-6% of premium per day. Holding long options becomes more expensive. Short premium strategies start capturing meaningful theta. The chart visually shows this acceleration as the decay lines steepen.
Late-cycle collapse on FINNIFTY as of 13 October 2026
In the final 2-3 days before expiry, Nifty Financial Services option decay is extreme. ATM options can lose 20-40% of their value per day. The chart shows this as nearly vertical lines pointing down. Short premium trades thrive in this window; long premium trades are high-risk without immediate directional movement.
Nifty Financial Services (FINNIFTY) Premium Decay: Strategies That Exploit Decay
Strategy 1: short strangles on FINNIFTY
Short strangles sell OTM calls and puts simultaneously. The trade profits from theta decay if Nifty Financial Services stays in range. The decay chart is perfect for managing these trades — you can see both legs decaying and estimate your profit in real time. Best deployed with 7-10 days to expiry for optimal theta-to-risk ratio.
Strategy 2: iron condors on FINNIFTY
Iron condors are short strangles with protective wings. The wings limit maximum loss in exchange for some theta reduction. For FINNIFTY, iron condors are the preferred choice for traders who want theta income without unlimited risk. The decay chart shows all four legs, helping you manage the position.
Strategy 3: calendar spreads on FINNIFTY
Calendar spreads sell near-term options and buy far-term options at the same strike. The near-term decays faster than the far-term, creating profit. The decay chart helps confirm the differential decay — near-term lines should fall faster than far-term lines. When the differential is visible, the calendar is working.
Strategy 4: covered calls on FINNIFTY as of 13 October 2026
If you hold equity positions, selling covered calls against them captures decay income. Each month you collect theta on the sold call. Over time, this income adds up significantly. The decay chart confirms that your covered call is losing value as expected, validating the strategy.
Nifty Financial Services (FINNIFTY) Premium Decay: Frequently Asked Questions
What is theta for FINNIFTY options?
Theta is the daily rate of premium decay. For Nifty Financial Services ATM options, theta might be Rs. 5-15 per share per day early in the cycle and Rs. 30-50 per share per day in the final week. The exact value depends on the strike, days to expiry, and IV. The decay chart shows the effect visually.
How do I use the FINNIFTY decay chart?
Open the chart, select the strikes you care about, and watch how their premium lines drift lower through the session. Compare different strikes and different days to expiry. The chart is primarily a visual tool for understanding decay patterns on Nifty Financial Services.
Can decay be predicted?
Yes, approximately. Theta values are predictable from the Black-Scholes formula. What is not predictable is how IV changes affect the overall premium. Decay plus IV changes can produce faster or slower erosion than pure theta would suggest. Always account for both when forecasting decay.
Is the decay chart useful for beginners on FINNIFTY as of 13 October 2026
Very much so. Beginners often struggle with the concept of time decay because it is abstract. The chart makes it visible and intuitive. Spend 15-30 minutes watching the decay chart for a few sessions before trading options. The observation builds better instincts than any formula.
Premium Decay & Theta Analysis - NIFTY
Expert insights into NIFTY option price erosion, time value decay, and trading strategies • Real-time Data
Premium decay, also known as Theta decay, is the rate at which a NIFTY option's extrinsic value decreases as it approaches its expiration date. Options lose time value every day, causing their premiums to erode. This decay accelerates rapidly in the final days and hours before expiry.
Understanding premium decay is critical for NIFTY options traders:
• For Option Buyers: Time is your enemy. You need NIFTY to move significantly and quickly in your favor to overcome the daily loss of time value (theta). Buying OTM options close to expiry carries extreme decay risk.
• For Option Sellers (Writers): Time is your friend. Sellers profit from NIFTY options slowly losing value over time, even if the market remains completely flat.
The NIFTY Premium Decay Chart helps visualize how Call and Put premiums are eroding intraday.
1. High Put Premium Decay: If Put options are rapidly losing value while Calls hold steady or rise, it indicates bullish sentiment.
2. High Call Premium Decay: If Call options are losing value faster than Puts, it suggests bearish sentiment.
3. Identifying Sideways Markets: When both Call and Put premiums decay symmetrically, NIFTY is likely range-bound or consolidating.
Premium Decay Change shows the net change in premium value from the market open, making it easy to spot intraday trends and momentum shifts in NIFTY options.
Total Premium (Call vs Put) displays the absolute premium values at any given time, which is useful to compare overall positioning and find out which side (Calls or Puts) is commanding higher premiums.
For a comprehensive options analysis of NIFTY, combine this tool with:
Track ATM Straddle premiums to spot volatility crush or expansion.
Understand the broader options market sentiment via PCR trends.
Check real-time Greeks including Theta values for specific strikes.
FINNIFTY premium decay: quick reference
| Time to expiry | Decay pace (theta) | For buyers | For sellers |
|---|---|---|---|
| Far — over 20 days | Slow and steady | Cheap time drag; room to be right | Little premium banked per day |
| Mid — 7 to 20 days | Moderate, building | Decay manageable; trend trades viable | Steady theta income begins |
| Near — 2 to 6 days | Fast, accelerating | Gains erode quickly; need prompt moves | Prime theta-harvesting window |
| Expiry eve — 1 day | Very fast | Only sharp moves overcome decay | Rich decay, but gamma risk climbs |
| Expiry day — 0 days | Extreme, intraday collapse | OTM premium can vanish by close | Maximum theta and maximum gamma risk |
Because FINNIFTY theta accelerates non-linearly, the same option loses far more value in its final days than in its first. Buyers pay this decay every session and need quick, directional moves; sellers harvest it and lean on the near-expiry buckets. The live chart above shows the actual slope, so you can see which decay regime FINNIFTY is trading in right now.
How to use the Premium Decay tool
- Pick a symbol, strike, and expiry — Choose your underlying, the strike you want to analyze, and the expiry. Most traders watch ATM ± 1 strike.
- Read the decay curve — Note the current premium and how it has decayed since the start of the session or since the option was first listed.
- Compare ATM vs OTM strikes — Switch between strikes to see how decay differs across the moneyness range. ATM decay is fastest in absolute terms.
- Plan your entry around theta — Use the steepest part of the decay curve as a guide for when to enter short-premium positions and when to exit.
- Cross-reference with the Straddle Chart — Open the Straddle Chart alongside Premium Decay for a combined view of single-leg theta and combined-leg expected move.
FINNIFTY Premium Decay — Frequently Asked Questions
How fast does FINNIFTY premium decay accelerate near expiry?
FINNIFTY premium decay is non-linear and accelerates sharply as expiry nears, because time value shrinks roughly in proportion to the square root of the time left. A weekly at-the-money option that sheds a few rupees a day early in its life can lose 40-60% of its value on expiry day, with the steepest erosion in the final trading hours.
How does FINNIFTY premium decay differ for ATM, ITM, and OTM options?
At-the-money FINNIFTY options carry the most extrinsic value, so they show the largest absolute theta decay. In-the-money options are mostly intrinsic value and decay slowly. Deep out-of-the-money options have little premium to lose and drift down gradually until they collapse toward zero in the final hours of expiry day.
Why does implied volatility change the FINNIFTY premium decay rate?
Higher implied volatility inflates the extrinsic value of FINNIFTY options, so there is more premium available to decay away each day. A high-IV option loses more rupees per day to theta than a low-IV option with the same expiry. This is why premium sellers prefer to write FINNIFTY options when IV is elevated.
When does the FINNIFTY premium decay chart update?
During NSE market hours (9:15 AM to 3:40 PM IST) the FINNIFTY premium decay chart streams live over WebSocket and refreshes every minute as option prices tick. Outside market hours it shows the last completed session, and historical mode lets you replay premium decay for any past FINNIFTY expiry.
How do option sellers profit from FINNIFTY premium decay?
Sellers collect FINNIFTY option premium upfront and keep the portion that theta erodes each day the position stays open. Selling closer to expiry captures faster decay. Short straddles, strangles, iron condors, and credit spreads all monetize this erosion — the trade-off is gamma risk if FINNIFTY makes a sharp, sudden move.
Learn more
Read our guide: Option Premium Decay: How Theta Eats Premiums into Expiry