SENSEX ATM Straddle Chart | Live Rolling Straddle
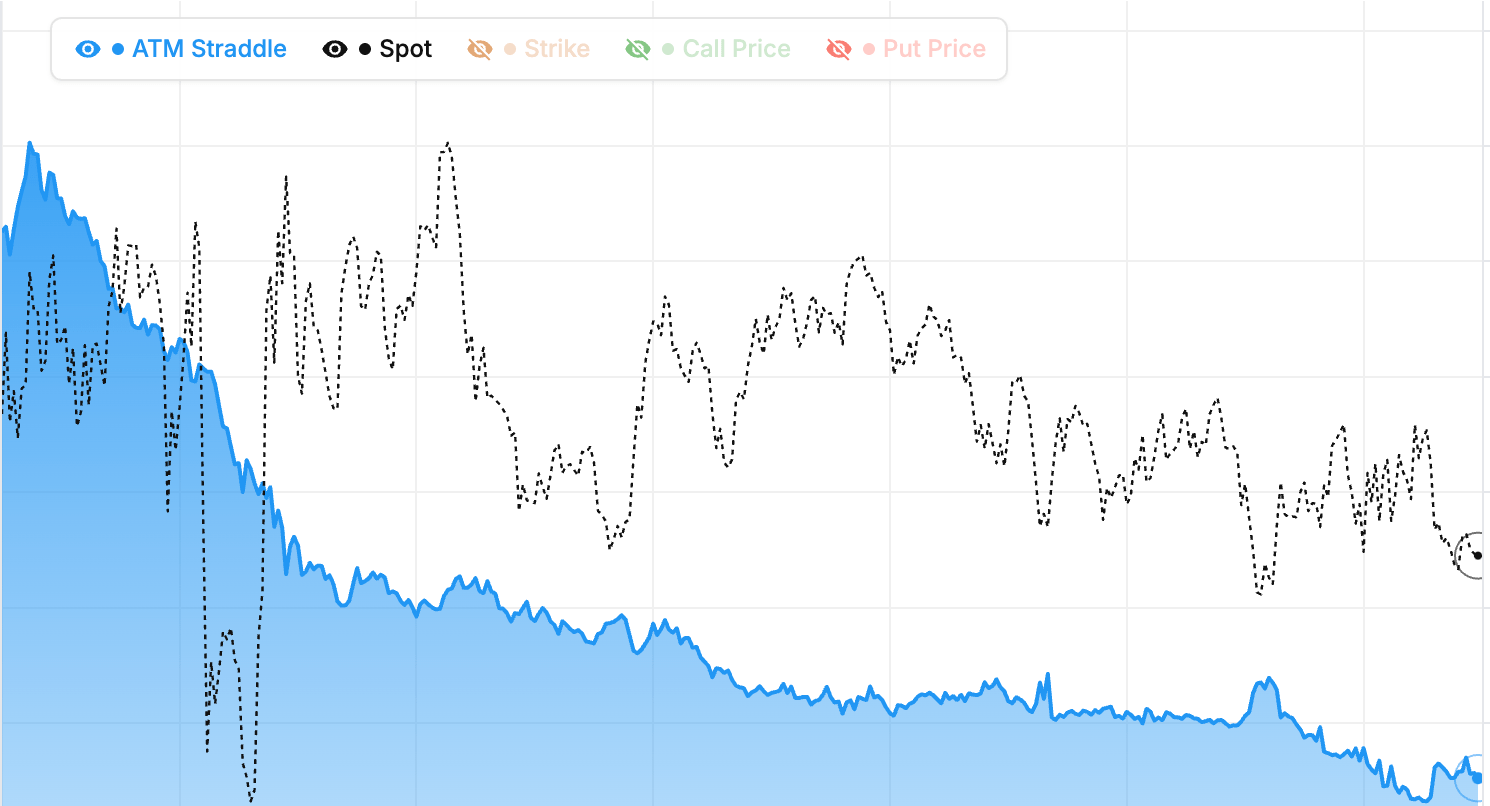
ATM straddle premium for SENSEX is the sum of the at-the-money call and put prices — one number that captures everything the option market believes about the underlying's near-term volatility. Our rolling straddle chart tracks that combined premium continuously, re-centring on the new ATM strike as spot moves, so what you see is the pure cost of volatility rather than the noise of individual strikes ticking in and out of ATM.
For SENSEX, the ATM straddle also gives you the market-implied expected move — roughly 0.85 times the straddle premium until expiry. If the SENSEXweekly straddle prints at 200, the market is pricing roughly a ±170 move over the remainder of the week. Traders use this to set realistic targets and position sizes, and option sellers use it to decide whether the premium is rich enough to justify the implied range. Premium decay through the day is also visible — theta burns most aggressively in the last 90 minutes of a SENSEX weekly expiry.
How to use the SENSEX straddle chart
A rising SENSEX straddle premium through the session signals volatility expansion, usually driven by an unexpected news catalyst or a fast directional move. A falling straddle against flat spot is classic pre-expiry theta decay — the bread and butter of option-selling strategies. Watch the ATM straddle around major events like RBI policy, budget announcements, and monthly expiry to see how the market's volatility expectations are being repriced in real time. Live mode streams SENSEX straddle updates throughout the NSE session.
Combine with our Premium Decay Chart, IV Chart, and Live Option Chain for complete SENSEX volatility and premium analysis on NSE F&O.
BSE Sensex (SENSEX) Straddle Chart: Live vs Historical Mode
What does the live SENSEX straddle chart show?
Live mode displays the BSE Sensex ATM straddle price updating continuously during NSE market hours (9:15 AM to 3:30 PM IST). Every minute, the chart adds a new data point reflecting the current combined ATM premium. You can watch theta decay in real time, see volatility expand or contract, and time your entries around the live curve. Live mode is most useful for intraday traders actively managing positions.
Why use historical mode for SENSEX straddle charts?
Historical mode lets you replay the SENSEX straddle chart for any past trading day. This is invaluable for studying past events — how did BSE Sensex straddle behave before and after the last budget? How did theta decay unfold on a quiet Wednesday? What did IV crush look like after earnings? Seeing real past data builds your pattern recognition much faster than reading theory.
Studying past SENSEX expiry days
A particularly useful exercise is pulling up historical BSE Sensex straddle charts from recent expiry days. Watch how the straddle price collapsed from Monday to Thursday. Note when the decay accelerated. Observe any intraday spikes. By studying 5-10 past expiries, you develop an intuitive sense of how much decay is normal, when it usually happens, and what events disrupt the pattern. This translates directly into better timing for live trades.
Comparing live and historical SENSEX straddle behaviour
Sometimes it helps to compare today's live chart to a historical chart from a similar setup. If today is Wednesday of an expiry week and SENSEX straddle is at Rs. 120, pull up historical data from the last 3-4 Wednesdays of expiry weeks. Are you in the typical range, or is today unusually high or low? As of 26 July 2026, this comparison technique adds context that raw numbers alone cannot provide for BSE Sensex trading decisions.
BSE Sensex (SENSEX) Straddle Chart: Pro Tips
Tip 1: Compare the SENSEX straddle to the cash index/stock range
Every morning, look at the BSE Sensex straddle and divide by spot. This gives you a quick percentage expected move. Then check SENSEX's actual range over the past few sessions — has it been moving more or less than the implied expectation? If actual moves have been smaller than implied, the options market is overpricing volatility (good for sellers). If actual moves have been larger, the market is underpricing (good for buyers).
Tip 2: Use the SENSEX straddle chart to avoid bad trades
Sometimes the best decision is to skip a trade. If the straddle chart shows extreme volatility expansion mid-session, it is usually not the time to sell premium. If the chart shows rapid IV compression, buying options is unlikely to pay. Use the chart as a "do not trade" filter when conditions are unfavourable. Preserving capital during bad setups is as valuable as making money during good ones.
Tip 3: Mark significant SENSEX straddle levels on your chart
Note the straddle values that correspond to common thresholds: low-volatility regime, normal regime, elevated regime, extreme regime. For BSE Sensex, these levels change over time with broader market conditions. Update your mental model every 2-3 months by reviewing historical data. Knowing where today sits relative to these levels is more useful than absolute numbers.
Tip 4: Journal your SENSEX straddle observations
Keep a simple trading journal. Each day, note: the opening straddle, the closing straddle, whether IV expanded or contracted, any major events, and how your trades performed. Over 30-60 days, patterns emerge. You notice that certain days of the week (Wednesdays, for example) have more predictable theta decay than others. You see that straddle spikes precede certain kinds of moves. These insights come from disciplined observation, not theory. As of 26 July 2026, a journal is the cheapest edge you can build on BSE Sensex straddle trading.
BSE Sensex (SENSEX) Straddle Chart: Multi-Expiry Analysis
Why compare SENSEX straddle prices across expiries?
BSE Sensex has multiple active expiries — weekly and monthly. Each expiry has its own ATM straddle price. The relationship between them tells you about the volatility term structure. If the weekly straddle is relatively high compared to the monthly, near-term volatility is being priced in (often before an imminent event). If the monthly is higher relative to weekly, medium-term uncertainty is greater than near-term.
Backwardation in SENSEX volatility
When the weekly straddle is higher than the proportional monthly straddle, the term structure is in backwardation. This typically happens before major events where the market knows a move is coming imminently. For SENSEX, backwardation is a signal to avoid buying weekly options (expensive) and consider selling them (collect inflated premium). The monthly options are relatively cheaper and might offer better value for directional bets.
Contango in SENSEX volatility
The normal state is contango — weekly straddle relatively cheaper than monthly on a per-day basis. Monthly options carry more time value because there is more uncertainty over the longer period. Contango is the default environment during calm markets. When the structure is in contango, selling monthly options gives you more absolute premium but you also take on more duration risk. Weekly options provide faster theta decay but smaller premiums.
Using term structure for SENSEX trades
Check both the BSE Sensex weekly and monthly ATM straddle prices at the start of each week. If the structure is steeply in backwardation, expect an event-driven environment — trade accordingly (avoid buying premium, consider short-duration premium selling). If contango is normal, trade in a standard volatility regime. As of 26 July 2026, this term structure check adds a layer of sophistication that most retail traders overlook. It takes 30 seconds and improves decision-making.
Straddle Chart: Video Walkthrough
SENSEX ATM straddle premium: quick reference
| Straddle premium | What's driving it | Volatility & theta read |
|---|---|---|
| Expanding fast | News catalyst or sharp move in SENSEX | Expected move re-pricing higher; long straddles gain, short premium hurts |
| Drifting up vs flat spot | IV expansion ahead of an event | Vega is overpowering theta; market bracing for a bigger move |
| Flat / holding steady | Steady IV offsetting normal decay | Expected move unchanged; watch for a breakout to resolve it |
| Slow steady decay | Quiet, range-bound SENSEX tape | Theta doing its job; classic premium-selling environment |
| Sharp collapse | Post-event IV crush or expiry-day theta | Extrinsic value evaporating; sellers win, long straddles bleed out |
These regimes describe how the combined ATM call-plus-put premium behaves, not a price target. On SENSEX, an expanding straddle warns of volatility expansion while a steady decay rewards option sellers. The live chart above re-centres on the ATM strike every minute during market hours, so you can see which regime SENSEX is trading in right now.
How to use the Straddle Chart
- Pick an underlying and expiry — Select Nifty, BankNifty, or an F&O stock and choose the expiry to track.
- Read the current straddle premium — The latest value approximates the market's implied move through expiry.
- Look at the intraday slope — Steady decay means the market is range-bound; rising premium means IV is expanding or a move is underway.
- Compare with prior expiries — Use historical mode to see how today's straddle premium compares to the same time slot in previous weeks.
- Cross-reference with Max Pain — Combine the straddle reading (size of expected move) with the Max Pain strike (likely target) to plan an expiry-day setup.
SENSEX Straddle Chart — Frequently Asked Questions
What is SENSEX straddle price today?
The SENSEX straddle price is the combined premium of ATM call and put options. It represents the market's expected move for the expiry. A straddle of 200 means market expects roughly 170 points move (0.85x) in either direction.
How to trade SENSEX straddle?
To trade SENSEX straddle: Buy straddle when expecting big move (before events). Sell straddle when expecting range-bound market. Watch straddle decay throughout the day - sellers benefit from theta, buyers need movement.
What is SENSEX expected move from straddle?
The expected move is approximately 0.85x the SENSEX straddle price. This gives you a probabilistic range for the underlying's movement until expiry. Use this to set realistic targets and stop losses.
Why does the SENSEX straddle premium decay through the day?
The SENSEX ATM straddle is pure extrinsic value — time value plus implied volatility — so it carries no intrinsic price to fall back on. Theta erodes that value every minute the underlying stays still, and the decay accelerates sharply as expiry nears. On expiry day a range-bound SENSEX straddle can shed 50-80% of its premium in one session.
How often does the SENSEX straddle chart update?
During NSE market hours (9:15 AM to 3:30 PM IST) the SENSEX straddle chart refreshes every minute, re-centring on the new ATM strike as spot moves so the line stays a true rolling straddle. Outside market hours it shows the last traded session, and historical mode replays SENSEX straddle premium for any past expiry.