INFY ATM Straddle Chart | Live Rolling Straddle
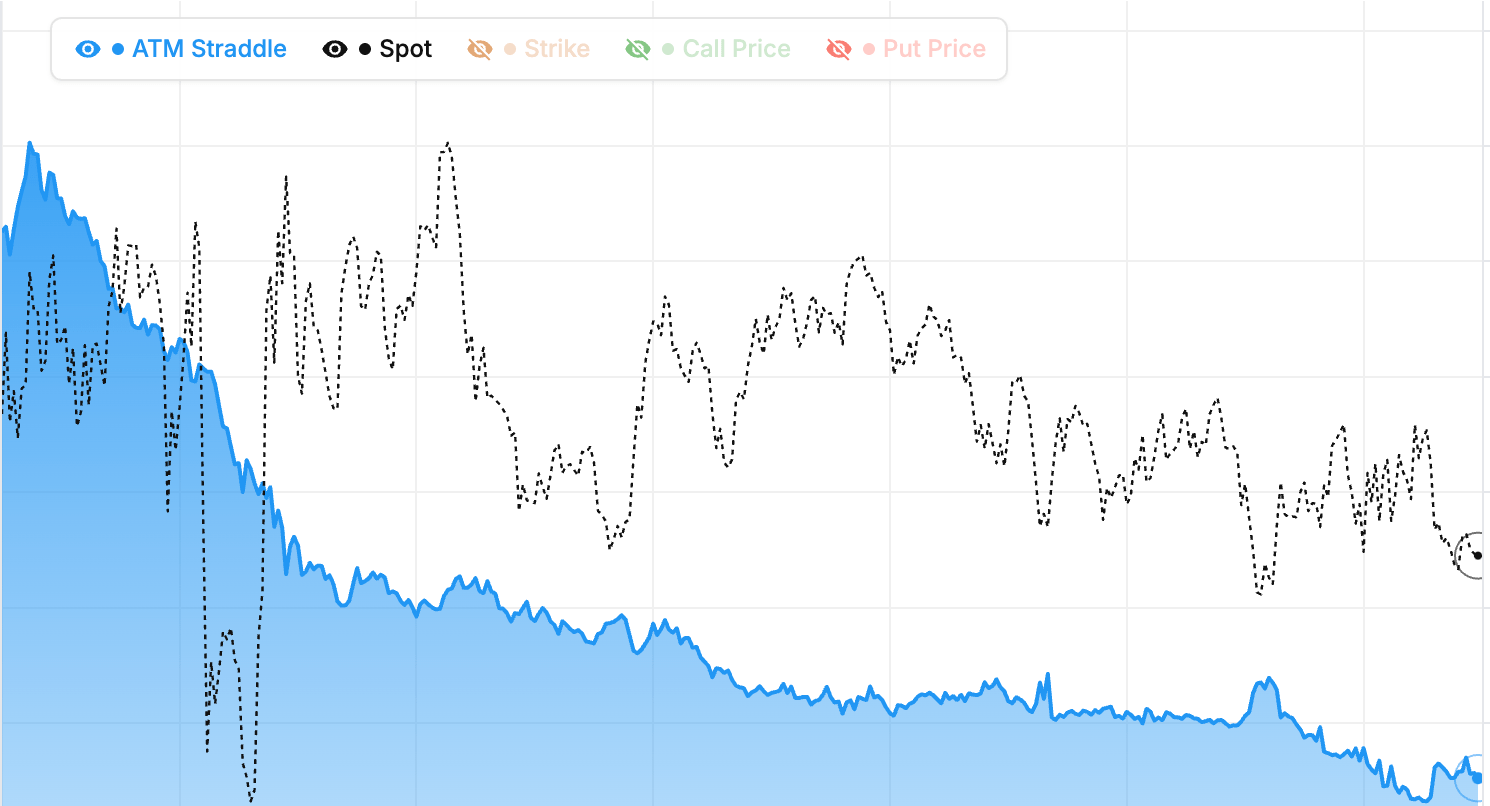
ATM straddle premium for INFY is the sum of the at-the-money call and put prices, one number that captures what the option market believes about the underlying's near-term volatility. Our rolling straddle chart tracks that combined premium continuously and re-centres on the new ATM strike as spot moves, so you're seeing the pure cost of volatility rather than the noise of individual strikes ticking in and out of ATM.
For INFY, the ATM straddle also gives you the market-implied expected move: roughly 0.85 times the straddle premium until expiry. If the INFY weekly straddle prints at 200, the market is pricing roughly a ±170 move over the remainder of the week. Traders use this to set realistic targets and position sizes, and option sellers use it to decide whether the premium is rich enough to justify the implied range. You can also watch the premium decay through the day. Theta burns most aggressively in the last 90 minutes of a INFY weekly expiry.
How to use the INFY straddle chart
A rising INFY straddle premium through the session signals volatility expansion, usually driven by an unexpected news catalyst or a fast directional move. When the straddle keeps falling while spot barely moves, that's classic pre-expiry theta decay, the bread and butter of option-selling strategies. Watch the ATM straddle around major events like RBI policy, budget announcements, and monthly expiry to see how the market's volatility expectations are being repriced in real time. Live mode streams INFY straddle updates throughout the NSE session.
Combine with our Premium Decay Chart, IV Chart, and Live Option Chain for complete INFY volatility and premium analysis on NSE F&O.
Infosys Ltd (INFY) ATM Straddle Chart: What It Shows
What is the INFY ATM straddle price?
The ATM straddle price for Infosys Ltd (INFY) is the combined premium of the at-the-money call and put options. If the INFY ATM call is trading at Rs. 120 and the ATM put is at Rs. 110, the straddle price is Rs. 230. This single number captures what the options market is collectively charging for exposure to Infosys Ltd volatility at the current price level. The straddle chart plots this combined premium over time so you can watch it rise and fall intraday.
Why is the INFY straddle chart useful?
The straddle chart is one of the cleanest ways to see how option premium on INFY is decaying through the session. Because you are watching the combined ATM premium rather than individual strikes, you filter out most of the noise from directional moves. A rising straddle line means volatility expectations are building — traders are paying more for options. A falling line means premium is being crushed by time decay or falling volatility. As a NIFTY constituent, Infosys Ltd ATM straddle is one of the most actively traded combinations on NSE.
What does a falling INFY straddle line signal?
A falling straddle chart usually reflects one of two things: theta decay (the natural erosion of time value as the day progresses) or IV crush (a sudden drop in implied volatility after an event or during quiet market conditions). On a normal trading day, Infosys Ltd ATM straddle will decay gradually through the session. On days following major events, it can collapse sharply in the first hour and then flatten. Watching the shape of the decline tells you whether the move is ordinary or event-driven.
What does a rising INFY straddle line signal?
A rising straddle line is unusual on normal days because time decay should pull it down. When the INFY straddle rises despite theta, it means implied volatility is expanding — the market is pricing in more future movement. This happens before events, during unexpected news, or when a big move is developing. As of 13 October 2026, a rising straddle is often an early warning that something significant is coming or already in progress. Pay attention.
Infosys Ltd (INFY) Straddle Chart: Expiry Day Dynamics
Why is expiry day special for INFY straddle charts?
Expiry day is when the Infosys Ltd straddle chart is most dramatic. Time value collapses from the morning to the close. A straddle worth Rs. 150 at 9:15 AM might be worth Rs. 30 at 2:00 PM and close near zero if INFY stays pinned. The decay is not linear — it accelerates throughout the session. Watching the live chart on expiry day is like watching a melting ice cube: the rate of decline speeds up as you get closer to the close.
Morning INFY straddle value on expiry day
The opening straddle value reflects any remaining overnight uncertainty. If the previous close was volatile or if an event happened overnight, the morning straddle is elevated. On a quiet morning after a calm previous session, the straddle is already low. Compare the opening value to the previous day's closing value — a large drop suggests IV crush has already happened, a smaller drop means uncertainty remains.
Final hour straddle behaviour on INFY expiry
From 2:30 PM to 3:30 PM on expiry day, the Infosys Ltd straddle typically collapses rapidly. Gamma is at its peak, and even small INFY moves create large relative premium changes. The straddle becomes extremely sensitive. This is when short sellers make their best gains (if price pins) and when buyers face their biggest risks (if price moves away from their strikes). Watch the chart closely — the shape of the final-hour decay tells you whether pinning is holding or failing.
Trading INFY straddles on expiry day
Expiry day straddle trading is high-risk, high-reward. The most common strategies are short straddles near the max pain strike (betting on pinning) and long straddles after unexpected moves (betting on continuation). Both have their place, but expiry day requires strict discipline: tight position sizing, firm stops, and no averaging down. As of 13 October 2026, many traders find expiry-day trading more rewarding when they wait for the final hour and take short-duration positions on clear setups.
Infosys Ltd (INFY) Straddle Chart: Rolling Strategy
What is a rolling INFY straddle?
A rolling straddle strategy on Infosys Ltd involves keeping a short straddle position continuously ATM by adjusting the strikes as INFY moves. If INFY moves significantly away from your original strike, you close the original position and open a new one at the new ATM. This keeps you always selling the strike with the highest theta decay, extracting maximum premium from time passing.
When rolling works for INFY
Rolling works best in range-bound or gently trending markets. If INFY drifts slowly, you can roll successfully and capture theta with manageable rolling losses. In sharp trends, rolling is very difficult — each roll locks in a loss from the previous position, and the new position faces the same directional pressure. Rolling is not a cure for bad directional views; it only works when volatility is higher than realised movement.
Rolling INFY straddles intraday
Intraday rolling is the most aggressive version of the strategy. You open a short straddle at the morning open, watch the chart, and roll whenever Infosys Ltd moves far enough to threaten the position. Each roll captures theta decay on the old position and resets the new position at ATM. At market close, you exit. This captures several hours of theta with active management but requires strict discipline and small position sizes.
Risk management in INFY rolling strategies
The key risk is accumulated rolling losses. Each roll costs money — you buy back losers and sell new positions. If the day is very volatile, these rolling losses can exceed the theta collected. Set a daily loss limit and stop rolling once you hit it. Never roll a position that has already lost more than the day's expected theta. As of 13 October 2026, disciplined rolling with strict rules can be profitable over time, but undisciplined rolling turns into a loss factory fast.
Straddle Chart: Video Walkthrough
INFY ATM straddle premium: quick reference
| Straddle premium | What's driving it | Volatility & theta read |
|---|---|---|
| Expanding fast | News catalyst or sharp move in INFY | Expected move re-pricing higher; long straddles gain, short premium hurts |
| Drifting up vs flat spot | IV expansion ahead of an event | Vega is overpowering theta; market bracing for a bigger move |
| Flat / holding steady | Steady IV offsetting normal decay | Expected move unchanged; watch for a breakout to resolve it |
| Slow steady decay | Quiet, range-bound INFY tape | Theta doing its job; classic premium-selling environment |
| Sharp collapse | Post-event IV crush or expiry-day theta | Extrinsic value evaporating; sellers win, long straddles bleed out |
These regimes describe how the combined ATM call-plus-put premium behaves, not a price target. On INFY, an expanding straddle warns of volatility expansion while a steady decay rewards option sellers. The live chart above re-centres on the ATM strike every minute during market hours, so you can see which regime INFY is trading in right now.
How to use the Straddle Chart
- Pick an underlying and expiry — Select Nifty, BankNifty, or an F&O stock and choose the expiry to track.
- Read the current straddle premium — The latest value approximates the market's implied move through expiry.
- Look at the intraday slope — Steady decay points to a range-bound market. A rising premium tells you IV is expanding or a move is underway.
- Compare with prior expiries — Use historical mode to see how today's straddle premium compares to the same time slot in previous weeks.
- Cross-reference with Max Pain — Combine the straddle reading (size of expected move) with the Max Pain strike (likely target) to plan an expiry-day setup.
INFY Straddle Chart — Frequently Asked Questions
What is INFY straddle price today?
The INFY straddle price is the combined premium of ATM call and put options. It represents the market's expected move for the expiry. A straddle of 200 means market expects roughly 170 points move (0.85x) in either direction.
How to trade INFY straddle?
To trade a INFY straddle, buy it when you expect a big move (ahead of events) and sell it when you expect a range-bound market. Watch the decay through the day. Sellers collect theta, while buyers need the underlying to actually move.
What is INFY expected move from straddle?
The expected move is approximately 0.85x the INFY straddle price. This gives you a probabilistic range for the underlying's movement until expiry. Use this to set realistic targets and stop losses.
Why does the INFY straddle premium decay through the day?
The INFY ATM straddle is pure extrinsic value (time value plus implied volatility), so it has no intrinsic price to fall back on. Theta erodes that value every minute the underlying stays still, and the decay accelerates sharply as expiry nears. On expiry day a range-bound INFY straddle can shed 50-80% of its premium in one session.
How often does the INFY straddle chart update?
During NSE market hours (9:15 AM to 3:40 PM IST) the INFY straddle chart refreshes every minute, re-centring on the new ATM strike as spot moves so the line stays a true rolling straddle. Outside market hours it shows the last traded session, and historical mode replays INFY straddle premium for any past expiry.
Learn more
Read our guide: ATM Straddle Explained: Straddle Price, Charts and the Expected Move