RELIANCE Multi-Strike Open Interest | Live OI Across Strikes
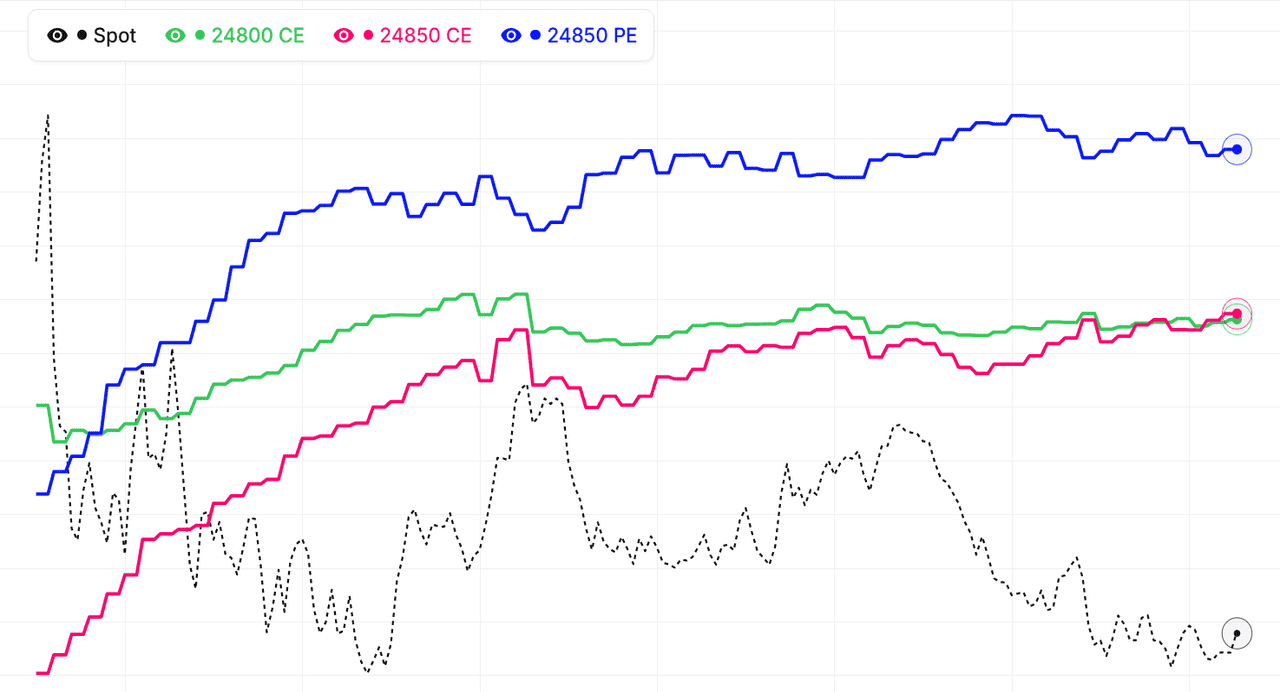
The multi-strike OI view for RELIANCE shows open interest for several strikes on a single chart — the total OI footprint across the option chain instead of one strike at a time. This makes it easy to see how institutional positioning is distributed acrossRELIANCE strikes: concentrated buildups reveal where writers are defending key levels, while OI unwinding across adjacent strikes signals that a directional move may be brewing as institutions exit structured positions.
Every strike's OI curve for RELIANCE can be added, removed, or hidden, so you can focus on just the ATM band, the full ±5% range around spot, or specific far-OTM strikes you're watching for tail-risk hedging activity. You can track both total OI and OI change (the more important series for intraday reads), across all active expiries. Weekly expiries usually show faster, more reactive flows; monthly expiries show deeper institutional commitment in RELIANCE option chains.
Reading the RELIANCE multi-strike OI footprint
A heavy OI cluster at a RELIANCE strike that's also showing rising total OI is a strong support or resistance reading — institutions are willing to sell more premium there, confident the strike will hold. When the cluster starts shedding OI (positive spot move into the strike but OI dropping), that's the classic unwinding signature that often precedes a breakout on RELIANCE. The multi-strike view makes it obvious when this is happening at one strike or spreading across several. Live mode keeps each strike's OI updated across the NSE session.
Combine multi-strike OI with our Multi-Strike Volume, Total OI Chart, Smart OI Detection, and Live Option Chain to build a full picture of RELIANCE NSE option-market positioning.
Reliance Industries Ltd (RELIANCE) Multi-Strike OI: Pro Tips
Tip 1: Focus on rate of change, not absolute OI
The speed at which Reliance Industries Ltd OI is changing at a strike matters more than its absolute value. A strike going from 1 lakh to 2 lakh OI in one session is more meaningful than a strike sitting stubbornly at 5 lakh for weeks. Rapid changes signal active interest; static high OI often reflects old positioning that has become irrelevant. Train your eye to notice rates of change, not just levels.
Tip 2: Watch the edges of the RELIANCE range
The most informative strikes are usually at the edges of the active range, not the middle. Strikes at the highest put OI and highest call OI levels are the decision points. If these strikes see meaningful changes (accumulation or unwinding), the entire range is shifting. Middle strikes tend to be less informative because they are not actively being defended by anyone.
Tip 3: Build consistent RELIANCE habits
Check the multi-strike view at the same times each day — opening (9:15-9:30), mid-morning (10:30), mid-day (12:30), and closing hour (2:30-3:30). Consistency beats randomness. By observing at fixed times, you build a mental model of how the RELIANCE OI evolves through each session. This baseline makes it easy to spot unusual activity when it happens.
Tip 4: Journal your RELIANCE multi-strike observations
Keep a simple trading journal. For each session, note: the strikes you watched, the patterns you saw, the trades you took, and the outcomes. Over weeks and months, you accumulate a personal database of what works for Reliance Industries Ltd. Generic advice is fine for learning the basics, but your own documented experience is what turns multi-strike OI into a real trading edge. As of 17 September 2026, the journal habit is one of the highest-value investments you can make. As a NIFTY constituent, Reliance Industries Ltd rewards traders who pair consistent observation with disciplined recording.
Reliance Industries Ltd (RELIANCE) Multi-Strike OI: Historical Mode Analysis
Why replay historical multi-strike OI for RELIANCE?
Historical mode lets you select any past trading date and see exactly how Reliance Industries Ltd multi-strike OI looked that day. You pick the date, the strikes, and the expiry, and the chart reconstructs the data. This is invaluable for studying how OI patterns preceded past RELIANCE moves — a skill that is almost impossible to develop from live data alone because you only see one day at a time.
Study routine for RELIANCE historical multi-strike OI
Each weekend, pick a significant Reliance Industries Ltd move from the past week or two. Open historical mode and replay the multi-strike OI from 3-5 sessions before the move. Note which strikes showed accumulation, which showed distribution, and when the pattern became clear. Did the multi-strike view give advance warning? If yes, what was the specific signal? Over 8-12 weeks of study, you build a catalog of recognisable patterns specific to RELIANCE.
Comparing RELIANCE historical and live patterns
The real value of historical study is pattern matching. When today's live multi-strike view looks similar to a historical pattern you studied, you have a higher-confidence setup. "This looks like the pattern before the breakout three weeks ago" is a far more useful thought than "I see some OI changes". Pattern matching requires familiarity, and familiarity comes from spending time with historical data.
Building a RELIANCE pattern library
Keep a simple library of the patterns you identify. For each pattern, note: the date, the strikes involved, what the OI did, what Reliance Industries Ltd price did afterward, and a short description. Over months, this library becomes your personalized playbook. When live conditions match a library entry, you know what to expect. As of 17 September 2026, this disciplined approach is what turns the multi-strike tool from a visualisation into a trading edge.
Reliance Industries Ltd (RELIANCE) Multi-Strike OI: Institutional Footprints
How institutions leave footprints in RELIANCE multi-strike OI
Institutional traders (FIIs, mutual funds, proprietary desks) leave identifiable patterns in Reliance Industries Ltd OI. They build positions gradually over multiple sessions, not in one day. They concentrate at near-ATM strikes where hedging is most efficient. They often trade in the opening hour (9:15-10:15) and final hour (2:30-3:30). The multi-strike view lets you observe these patterns and distinguish institutional activity from retail noise.
Slow steady RELIANCE accumulation
A classic institutional pattern is slow, steady accumulation over 3-5 sessions. The multi-strike view shows a strike whose OI line rises gradually day after day, without dramatic spikes. This is smart money carefully building a position without tipping off the market. If you see this pattern, consider aligning with it — institutions are usually right more often than they are wrong.
Block-sized RELIANCE positioning
Sometimes institutions take large block positions all at once. The multi-strike view captures these as sudden, large jumps in OI at a specific strike. These trades are often done through specific windows when liquidity is available. The key signal is size relative to normal activity. A 100,000-contract jump at a strike that normally sees 20,000 is clearly institutional, not retail.
Following institutional flow on RELIANCE
Identifying institutional activity is only useful if you act on it. The general rule: trade in the direction of institutional positioning, not against it. If institutions are building put OI at your support strike, they are defending the level — lean bullish. If they are building call OI at resistance, they are defending the ceiling — lean bearish. As of 17 September 2026, following smart money is usually more profitable than trying to predict independently.
RELIANCE multi-strike OI patterns: quick reference
| OI pattern across strikes | Positioning | Common reading |
|---|---|---|
| Call OI rising at adjacent strikes above spot | Resistance wall building | Upside capped near the cluster until writers cover |
| Put OI rising at adjacent strikes below spot | Support wall building | Downside defended near the cluster on RELIANCE |
| Call OI falling at one strike, rising at the next higher | Call writers rolling up | Bullish — the effective resistance is shifting higher |
| Put OI falling at one strike, rising at the next lower | Put writers rolling down | Bearish — the effective support is shifting lower |
| Call and put OI both peaking at the same strike | Two-sided writing | Expiry pinning candidate; price gravitates to that strike |
| OI unwinding across several adjacent strikes | Writers exiting the zone | Defended zone weakening; breakout risk rising |
These patterns describe how OI typically migrates across NSE strikes, not fixed rules — always confirm with price action before trading them. The live RELIANCE chart above plots total OI and change in OI for every selected strike, so you can watch walls build, writers roll, and unwinding start in real time.
How to use Multistrike OI
- Pick an underlying and expiry — Choose Nifty, BankNifty, or an F&O stock and select the expiry you want to analyze.
- Set the strike range — By default the view shows ATM ± 5 strikes. Widen the range if you want to see resistance/support strikes that are far from current price.
- Identify peaks in call and put OI — Look for the strike(s) where call OI and put OI both peak — these are the candidate pinning levels for the expiry.
- Watch OI shifts in real time — As the session progresses, monitor which strikes are gaining or losing OI. Migration up the ladder = bullish; down the ladder = bearish.
- Combine with Max Pain — Cross-reference the multistrike OI peak strike with the live max pain strike. When they agree, the pinning thesis is strongest.
RELIANCE MultiStrike OI — Frequently Asked Questions
What is RELIANCE MultiStrike OI?
RELIANCE MultiStrike OI plots open interest for several option strikes as overlaid time series on one chart, instead of one strike at a time. It shows where positions are concentrated across the RELIANCE option chain, so you can spot support and resistance walls, expiry pinning candidates, and OI migrating between strikes as the session develops.
How to interpret RELIANCE multi-strike OI data?
Watch which RELIANCE strikes are gaining or losing OI relative to their neighbours. Rising call OI at strikes above spot builds resistance; rising put OI below spot builds support. OI migrating up the strike ladder is bullish, migration down the ladder is bearish, and OI unwinding across adjacent strikes warns that a defended zone is giving way.
Which RELIANCE strikes should I select on the multi-strike OI chart?
Start with the highest call OI strike (resistance), the highest put OI strike (support), and the ATM strike plus two on either side — that band is where RELIANCE intraday positioning concentrates. StockMojo can auto-select the highest-OI or highest-volume strikes for each expiry, or you can track a custom list of up to 10 strikes.
How does RELIANCE multi-strike OI confirm a breakout or expiry pinning?
A breakout is usually preceded by OI rotating beyond the old wall — call writers rolling to higher RELIANCE strikes confirm upside, put writers rolling lower confirm downside. Pinning shows the opposite signature: call and put OI both peaking at one strike, which price tends to gravitate toward on expiry day as writers on both sides defend it.
How often does the RELIANCE MultiStrike OI chart update?
During NSE market hours (9:15 AM to 3:40 PM IST) the RELIANCE MultiStrike OI chart refreshes every minute from live option chain data, plotting both total OI and change in OI for every selected strike. Outside market hours it shows the last traded session, and historical mode lets you replay any past RELIANCE expiry.