INFY Multi-Strike Open Interest | Live OI Across Strikes
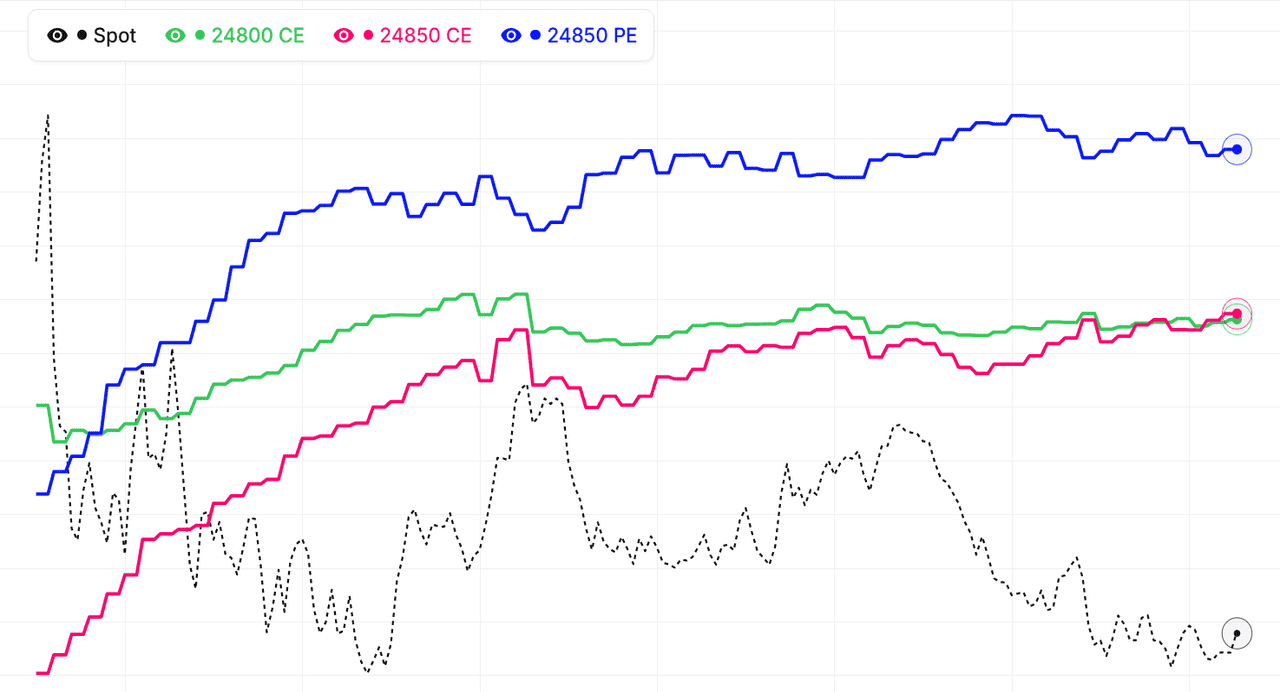
The multi-strike OI view for INFY shows open interest for several strikes on a single chart — the total OI footprint across the option chain instead of one strike at a time. This makes it easy to see how institutional positioning is distributed acrossINFY strikes: concentrated buildups reveal where writers are defending key levels, while OI unwinding across adjacent strikes signals that a directional move may be brewing as institutions exit structured positions.
Every strike's OI curve for INFY can be added, removed, or hidden, so you can focus on just the ATM band, the full ±5% range around spot, or specific far-OTM strikes you're watching for tail-risk hedging activity. You can track both total OI and OI change (the more important series for intraday reads), across all active expiries. Weekly expiries usually show faster, more reactive flows; monthly expiries show deeper institutional commitment in INFY option chains.
Reading the INFY multi-strike OI footprint
A heavy OI cluster at a INFY strike that's also showing rising total OI is a strong support or resistance reading — institutions are willing to sell more premium there, confident the strike will hold. When the cluster starts shedding OI (positive spot move into the strike but OI dropping), that's the classic unwinding signature that often precedes a breakout on INFY. The multi-strike view makes it obvious when this is happening at one strike or spreading across several. Live mode keeps each strike's OI updated across the NSE session.
Combine multi-strike OI with our Multi-Strike Volume, Total OI Chart, Smart OI Detection, and Live Option Chain to build a full picture of INFY NSE option-market positioning.
Infosys Ltd (INFY) Multi-Strike OI: Comparing Multiple Strikes at Once
What is multi-strike OI for INFY?
Multi-strike OI is a tool that lets you see open interest for several Infosys Ltd (INFY) option strikes on a single chart at the same time. Instead of scanning the option chain one strike at a time, you can pick 5, 10 or more strikes and watch their OI values side by side throughout the day. This makes it far easier to spot where fresh positioning is happening, which strikes are being defended, and which are being abandoned. As a NIFTY constituent, the multi-strike view is especially useful because INFY OI is spread across many active strikes.
Why do traders use multi-strike OI instead of the full option chain?
The option chain shows everything, which is useful but overwhelming during fast-moving sessions. Multi-strike OI lets you focus on the specific INFY strikes that matter to your trades. If your support and resistance levels are at 22500, 22600, and 22700, you can track just those three strikes in one view. You see how OI at each level is building or unwinding in real time. This focused view saves time and reduces analysis errors compared to scanning a busy option chain.
How does multi-strike OI help with INFY trading decisions?
Most trading decisions involve a handful of key levels, not the entire option chain. Multi-strike OI on Infosys Ltd lets you watch these levels closely without distraction. When fresh OI builds at your support strike, it confirms the level is being defended. When OI unwinds at your resistance, it signals the ceiling may give way. By isolating the critical strikes, the tool turns raw OI data into actionable signals that you can act on during the session.
Getting started with INFY multi-strike OI today
As of 17 September 2026, open the multi-strike OI tool and pick 5-8 strikes around the current INFY price. Include 2-3 strikes above and 2-3 strikes below the spot. Watch the chart as the session progresses. Note which strikes are growing in OI (positions being built) and which are falling (positions being closed). This simple setup gives you continuous awareness of how the options market is positioning on Infosys Ltd without needing to constantly check the full chain.
Infosys Ltd (INFY) Multi-Strike OI: Comparing Call vs Put Patterns
Why track both call and put OI on INFY multi-strike?
Calls and puts tell different stories. Call OI at higher strikes reflects expectations about upside limits. Put OI at lower strikes reflects expectations about downside limits. By tracking both sides in the multi-strike view for Infosys Ltd, you see the full picture of market expectations. Viewing only one side would be like reading half a conversation — you get the outline but miss the nuances.
Call OI dominance patterns on INFY
When call OI is systematically higher than put OI across the near-ATM strikes, call writers are dominant. This typically reflects a cautious market — traders are capping upside more than defending downside. It is not necessarily bearish, but it suggests limited upside. When this pattern shifts and put OI starts catching up to call OI, the market sentiment is turning more bullish on INFY.
Put OI dominance patterns on INFY
When put OI dominates across near-ATM strikes, put writers are confident that Infosys Ltd will hold. This is bullish for short-term direction — put sellers are taking the risk of supporting the market. If you see put OI consistently 1.5-2x call OI across multiple strikes, the options market is leaning bullish. When this dominance starts fading, sentiment is cooling.
Balanced call-put patterns on INFY
When call OI and put OI are roughly equal across the strike range, the market is in balance. Neither bulls nor bears dominate. This typically signals range-bound trading — price will oscillate within the OI zone without a clear breakout. Range-bound environments favour premium-selling strategies like iron condors. The multi-strike view makes it easy to spot this balance at a glance. As of 17 September 2026, a balanced multi-strike view is a green light for range strategies.
Infosys Ltd (INFY) Multi-Strike OI: Volume Correlation
Why combine INFY multi-strike OI with volume?
OI shows positioning. Volume shows activity. Both matter for a complete picture. High OI without corresponding volume is a stale position. High volume without OI change is churn — traders cycling in and out without fresh commitment. The best signals come from high OI change AND high volume at the same strike — fresh positioning with real participation. Watching both together gives you much higher confidence in Infosys Ltd signals.
Volume confirmation for OI changes
Always ask: is the OI change at this strike accompanied by volume? If yes, it is likely a real institutional-style move. If no, it is probably insignificant or incorrect data. Volume is the validator. An OI jump of 10,000 with volume of 50,000 is credible. The same OI jump with volume of 500 is suspicious. As of 17 September 2026, this simple validation filters out a surprising number of noise signals.
High volume + high OI change scenarios on INFY
When you see this combination at a Infosys Ltd strike, pay close attention. Traders are actively creating new positions at that level — it is a meaningful commitment. If the activity aligns with your trade thesis, it strengthens your conviction. If it contradicts your thesis, reconsider — the market is telling you something you may have missed. Either way, respect what the data is showing.
Low volume warning signals
Strikes with OI change but no supporting volume are warning signs. They may represent bad data, very small trades that do not reflect real conviction, or positions that will easily reverse. Do not build your trade thesis on these strikes. Focus your analysis on strikes with both OI change AND volume confirmation. This discipline prevents false signal trades and preserves capital over time.
INFY multi-strike OI patterns: quick reference
| OI pattern across strikes | Positioning | Common reading |
|---|---|---|
| Call OI rising at adjacent strikes above spot | Resistance wall building | Upside capped near the cluster until writers cover |
| Put OI rising at adjacent strikes below spot | Support wall building | Downside defended near the cluster on INFY |
| Call OI falling at one strike, rising at the next higher | Call writers rolling up | Bullish — the effective resistance is shifting higher |
| Put OI falling at one strike, rising at the next lower | Put writers rolling down | Bearish — the effective support is shifting lower |
| Call and put OI both peaking at the same strike | Two-sided writing | Expiry pinning candidate; price gravitates to that strike |
| OI unwinding across several adjacent strikes | Writers exiting the zone | Defended zone weakening; breakout risk rising |
These patterns describe how OI typically migrates across NSE strikes, not fixed rules — always confirm with price action before trading them. The live INFY chart above plots total OI and change in OI for every selected strike, so you can watch walls build, writers roll, and unwinding start in real time.
How to use Multistrike OI
- Pick an underlying and expiry — Choose Nifty, BankNifty, or an F&O stock and select the expiry you want to analyze.
- Set the strike range — By default the view shows ATM ± 5 strikes. Widen the range if you want to see resistance/support strikes that are far from current price.
- Identify peaks in call and put OI — Look for the strike(s) where call OI and put OI both peak — these are the candidate pinning levels for the expiry.
- Watch OI shifts in real time — As the session progresses, monitor which strikes are gaining or losing OI. Migration up the ladder = bullish; down the ladder = bearish.
- Combine with Max Pain — Cross-reference the multistrike OI peak strike with the live max pain strike. When they agree, the pinning thesis is strongest.
INFY MultiStrike OI — Frequently Asked Questions
What is INFY MultiStrike OI?
INFY MultiStrike OI plots open interest for several option strikes as overlaid time series on one chart, instead of one strike at a time. It shows where positions are concentrated across the INFY option chain, so you can spot support and resistance walls, expiry pinning candidates, and OI migrating between strikes as the session develops.
How to interpret INFY multi-strike OI data?
Watch which INFY strikes are gaining or losing OI relative to their neighbours. Rising call OI at strikes above spot builds resistance; rising put OI below spot builds support. OI migrating up the strike ladder is bullish, migration down the ladder is bearish, and OI unwinding across adjacent strikes warns that a defended zone is giving way.
Which INFY strikes should I select on the multi-strike OI chart?
Start with the highest call OI strike (resistance), the highest put OI strike (support), and the ATM strike plus two on either side — that band is where INFY intraday positioning concentrates. StockMojo can auto-select the highest-OI or highest-volume strikes for each expiry, or you can track a custom list of up to 10 strikes.
How does INFY multi-strike OI confirm a breakout or expiry pinning?
A breakout is usually preceded by OI rotating beyond the old wall — call writers rolling to higher INFY strikes confirm upside, put writers rolling lower confirm downside. Pinning shows the opposite signature: call and put OI both peaking at one strike, which price tends to gravitate toward on expiry day as writers on both sides defend it.
How often does the INFY MultiStrike OI chart update?
During NSE market hours (9:15 AM to 3:40 PM IST) the INFY MultiStrike OI chart refreshes every minute from live option chain data, plotting both total OI and change in OI for every selected strike. Outside market hours it shows the last traded session, and historical mode lets you replay any past INFY expiry.