RELIANCE Multi-Strike Option Volume | Live Volume Across Strikes
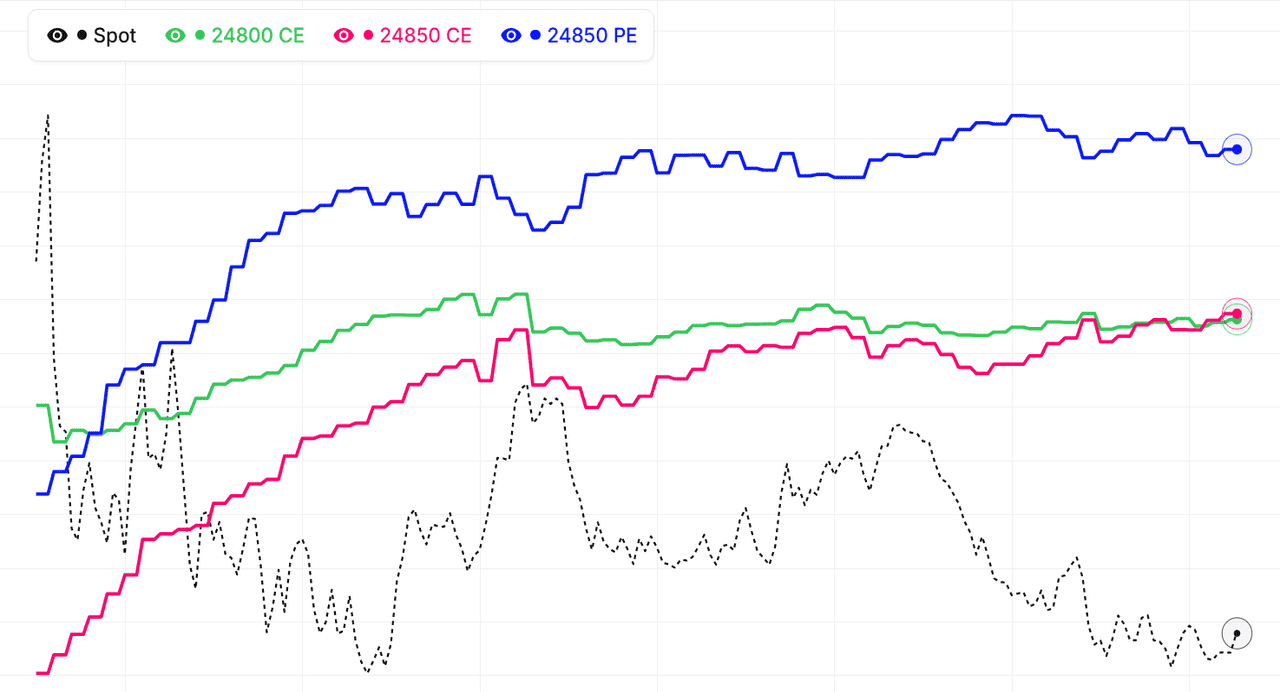
The multi-strike volume view for RELIANCE shows traded option volume for several strikes on a single chart — the full activity footprint across the option chain instead of one strike at a time. This makes it easy to see where RELIANCE option flow is concentrating: volume clustering at a strike means traders are actively engaging that level, while volume rotating to higher or lower strikes signals the market repositioning ahead of a directional move.
Every strike's volume curve for RELIANCE can be added, removed, or hidden, so you can focus on the ATM band, your key support and resistance strikes, or specific far-OTM strikes you're watching for unusual activity, across all active expiries. Volume leads open interest — it registers every trade immediately, so activity shows up here before the OI chart confirms whether positions are being built.
Reading the RELIANCE multi-strike volume footprint
A RELIANCE strike showing heavy volume alongside rising open interest means new positions are being built with conviction. Heavy volume with flat OI is intraday churn — common at the ATM strike on expiry day. A sudden volume burst at a previously quiet strike is an early warning that the level is coming into play, often minutes before the OI reacts. Live mode keeps each strike's volume updated across the NSE session.
Combine multi-strike volume with our Multi-Strike OI, Total OI Chart, and Live Option Chain to build a full picture of RELIANCE NSE option-market activity.
Reliance Industries Ltd (RELIANCE) Multi-Strike Volume vs the Option Chain
Why not just read volume from the RELIANCE option chain?
The option chain shows each strike's volume as a number in a table — a snapshot with no history. You can see that a Reliance Industries Ltd strike has traded 50 lakh contracts, but not whether that happened in a burst at 10 AM or accumulated steadily all day, and the difference matters enormously for interpretation. The multi-strike volume chart turns those numbers into time series, restoring the when that the chain throws away.
When is the chain still the better tool for RELIANCE?
For breadth. The chain shows every strike at once, so it is the right place to scan for which levels are active before you know where to look. A sensible division of labour: scan the RELIANCE chain (or use High Volume auto-selection, which does the scan for you) to find the strikes that matter, then move to the multi-strike chart to study how activity at those strikes is evolving.
What patterns only appear in the time-series view?
Rotation, acceleration, and divergence. Rotation — volume migrating across strikes as RELIANCE moves — is invisible in a snapshot. Acceleration — a strike's volume curve steepening — distinguishes a level coming alive from one that was busy hours ago. Divergence — price pushing higher while call volume at overhead strikes dries up — is one of the better fade signals on Reliance Industries Ltd, and it only exists as a comparison across time.
Building both into your RELIANCE routine
As of 17 September 2026: chain for the morning scan, multi-strike volume for live monitoring, multi-strike OI for confirmation, and the option chain again near the close for the final positioning picture. Each tool answers a different question. The multi-strike volume chart's question — where is the market active right now, and is that activity growing? — is the one most intraday RELIANCE decisions actually hinge on.
Reliance Industries Ltd (RELIANCE) Multi-Strike Volume for Intraday Traders
Why should intraday RELIANCE traders watch option volume?
Because option volume measures urgency. Price can drift on low conviction, but option volume only spikes when traders decide a level matters enough to pay for exposure right now. For Reliance Industries Ltd intraday trading, the strikes drawing the heaviest volume are a live map of the levels the market is actively defending or attacking — usually a sharper map than static support/resistance lines drawn before the open. As a NIFTY constituent, RELIANCE has deep enough option liquidity that this map updates meaningfully all session.
Why does each strike lane show interval volume instead of a running total?
A running total always rises, which hides when activity actually happened. Each strike lane plots volume as it prints through the session — so a strike that did all its business in the first hour goes quiet visibly, while a strike attracting fresh afternoon flow keeps spiking. The bottom Total Volume lane adds the running day total across all selected strikes, so you get both reads: when each RELIANCE strike traded, and how much business the whole selection has done so far.
What volume pattern precedes a range break on RELIANCE?
Compression then expansion. During the range, volume concentrates at the strikes bounding it — both sides churning at the edges. Just before a break, you often see volume bleed toward strikes beyond one boundary: traders quietly buying options outside the range before price gets there. When Reliance Industries Ltd then tests that boundary, the pre-positioned side accelerates. The multi-strike view shows the bleed while the range still looks intact.
A minimal intraday setup for RELIANCE
As of 17 September 2026: select RELIANCE, current weekly expiry, High Volume selection with 6 strikes, and keep the chart on a second monitor or tab. Glance at it whenever price approaches a level you care about. The question is always the same — is the option market participating in this test, or ignoring it? Participation validates the level; silence tells you to expect chop.
Reading Reliance Industries Ltd (RELIANCE) Option Activity: Volume + OI Together
What does high volume with rising OI mean at a RELIANCE strike?
This is the strongest signal combination: contracts are trading heavily AND net new positions are being created. Whoever is active at that Reliance Industries Ltd strike is committing, not scalping. If it is a call strike above the current price, writers may be building a resistance wall or buyers may be positioning for a breakout — the premium direction and price behaviour tell you which. Either way, the strike now carries conviction and deserves a place on your watchlist.
What does high volume with flat OI tell you?
Pure churn. Traders are entering and exiting RELIANCE positions within the session without leaving anything behind. This is common at the ATM strike and on expiry days. Churn signals liquidity and interest but not commitment — the level matters to day traders, not to positional money. Treat price reactions at churn-heavy strikes as short-lived.
What about low volume with high OI on RELIANCE?
That is stale positioning — contracts built up in earlier sessions that nobody is actively trading today. These strikes still matter as reference levels (the positions exist and will need to be closed eventually), but they are not where today's battle is. A burst of fresh volume at a stale high-OI strike is worth attention: old positions may be starting to unwind, which often releases the level's hold on price.
How to run this analysis on RELIANCE in practice
As of 17 September 2026, the StockMojo multi-strike tools make the pairing trivial: the Volume and OI views share the same strike selection, and a single toggle switches between them. Load your key RELIANCE strikes once, then alternate views to classify each strike — committed, churning, or stale. The classification updates through the day as flows change.
RELIANCE multi-strike volume signals: quick reference
| Volume signal | OI behaviour | Common reading |
|---|---|---|
| Heavy volume at a strike | OI rising | Fresh positions being built; the level carries conviction |
| Heavy volume at a strike | OI falling | Positions unwinding; the level is being abandoned or breached |
| Heavy volume at a strike | OI flat | Intraday churn; common at the RELIANCE ATM strike on expiry day |
| Volume burst at a quiet strike | Not yet moved | Early warning the level is coming into play, before OI reacts |
| Volume rotating to higher call strikes | OI rising above spot | Bullish engagement; traders paying up for a breakout |
| Low volume at a strike | OI high | Stale positioning from earlier sessions; no fresh defence today |
Volume registers every trade instantly while open interest updates only as net positions change, so the RELIANCE volume chart above always leads. Pair any volume spike with its OI behaviour before treating it as a directional signal, and remember that expiry-day churn at the ATM strike inflates volume without conviction.
How to use Multistrike Volume
- Pick an underlying and expiry — Choose Nifty, BankNifty, or an F&O stock and select the expiry you want to analyze.
- Select strikes to compare — Use High Volume auto-selection to load the most actively traded strikes, or pick custom strikes around your key levels.
- Find where activity concentrates — Look for the strikes attracting the most call and put volume — these are the levels the market is actively trading and watching.
- Watch volume rotation in real time — As the session progresses, monitor whether volume migrates to higher or lower strikes. Rotation up the ladder = bullish engagement; down = bearish.
- Confirm with OI — Switch to the Multistrike OI view to check whether the volume is building positions (OI rising) or just churning (OI flat).
RELIANCE MultiStrike Volume — Frequently Asked Questions
What is RELIANCE MultiStrike Volume?
RELIANCE MultiStrike Volume chart shows traded option volume for multiple strikes on one view. This helps identify where market activity is concentrating and which levels traders are actively engaging.
How to interpret RELIANCE multi-strike volume data?
Watch for strikes with rapidly rising volume - these are the levels in play right now. Compare Call and Put volume across strikes, and confirm with open interest to see whether activity is building positions or just intraday churn.
What does high volume with flat OI mean at a RELIANCE strike?
High volume with flat open interest means contracts are changing hands intraday without new net positions being created — scalpers churning the strike. This is common at the RELIANCE ATM strike on expiry day and signals liquidity, not conviction. When volume and OI rise together at the same strike, fresh positions are being built and the level carries real weight.
Can I use RELIANCE multi-strike volume on expiry day?
Yes — expiry day is where the volume view works best. Open interest becomes hard to read as positions unwind, but volume shows which RELIANCE strikes the market is fighting over hour by hour. The strike attracting the most combined call and put volume in the final hours frequently acts as the settlement magnet.
How often does the RELIANCE multi-strike volume chart update?
During NSE market hours (9:15 AM to 3:40 PM IST) the RELIANCE multi-strike volume chart refreshes every minute from live option chain data. Outside market hours it shows the last traded session, and historical mode lets you replay how volume was distributed across RELIANCE strikes on any past expiry.