SBIN Multi-Strike Option Volume | Live Volume Across Strikes
The multi-strike volume view for SBIN shows traded option volume for several strikes on a single chart — the full activity footprint across the option chain instead of one strike at a time. This makes it easy to see where SBIN option flow is concentrating: volume clustering at a strike means traders are actively engaging that level, while volume rotating to higher or lower strikes signals the market repositioning ahead of a directional move.
Every strike's volume curve for SBIN can be added, removed, or hidden, so you can focus on the ATM band, your key support and resistance strikes, or specific far-OTM strikes you're watching for unusual activity, across all active expiries. Volume leads open interest — it registers every trade immediately, so activity shows up here before the OI chart confirms whether positions are being built.
Reading the SBIN multi-strike volume footprint
A SBIN strike showing heavy volume alongside rising open interest means new positions are being built with conviction. Heavy volume with flat OI is intraday churn — common at the ATM strike on expiry day. A sudden volume burst at a previously quiet strike is an early warning that the level is coming into play, often minutes before the OI reacts. Live mode keeps each strike's volume updated across the NSE session.
Combine multi-strike volume with our Multi-Strike OI, Total OI Chart, and Live Option Chain to build a full picture of SBIN NSE option-market activity.
State Bank of India (SBIN) Multi-Strike Volume: Watching Activity Across Strikes
What is multi-strike volume for SBIN?
Multi-strike volume is a chart view that plots traded option volume for several State Bank of India (SBIN) strikes on a single chart at the same time. Instead of scanning the option chain row by row, you pick the strikes you care about and watch their volume build through the session side by side. Volume is the option market's activity meter — it spikes the moment traders engage a strike, which makes this view one of the fastest ways to see which SBIN levels are in play right now. As a NIFTY and BANKNIFTY and FINNIFTY constituent, SBIN options attract enough flow that volume patterns across strikes carry real information.
How is volume different from open interest on SBIN options?
Volume counts every contract traded during the day; open interest counts contracts still outstanding. A SBIN strike can print huge volume while OI stays flat — that is intraday churn, traders entering and exiting within the session. Or it can build OI steadily on moderate volume — quiet accumulation. Volume tells you where the action is; OI tells you whether that action left positions behind. Reading the two together is far more reliable than either alone, and the multi-strike volume view is the activity half of that pair.
Why watch several SBIN strikes at once?
Because activity migrates. As State Bank of India moves during the day, option flow rotates from one strike to the next — and that rotation is often visible before the price move completes. If call volume starts jumping at strikes above the current resistance, traders are paying for upside participation early. A single-strike view misses this entirely; the multi-strike view makes the wave of activity moving up or down the strike ladder obvious at a glance.
Getting started with SBIN multi-strike volume today
As of 17 September 2026, open the tool, select SBIN and your expiry, and use the High Volume option to auto-load the most actively traded strikes. Watch which strikes keep attracting fresh volume as the session progresses and which go quiet. Then flip to the Multi-Strike OI view (one click) to check whether the busy strikes are building positions or just churning. That two-step read — activity first, commitment second — is the core workflow.
How to Use the State Bank of India (SBIN) Multi-Strike Volume Tool
Setting up your first SBIN multi-strike volume chart
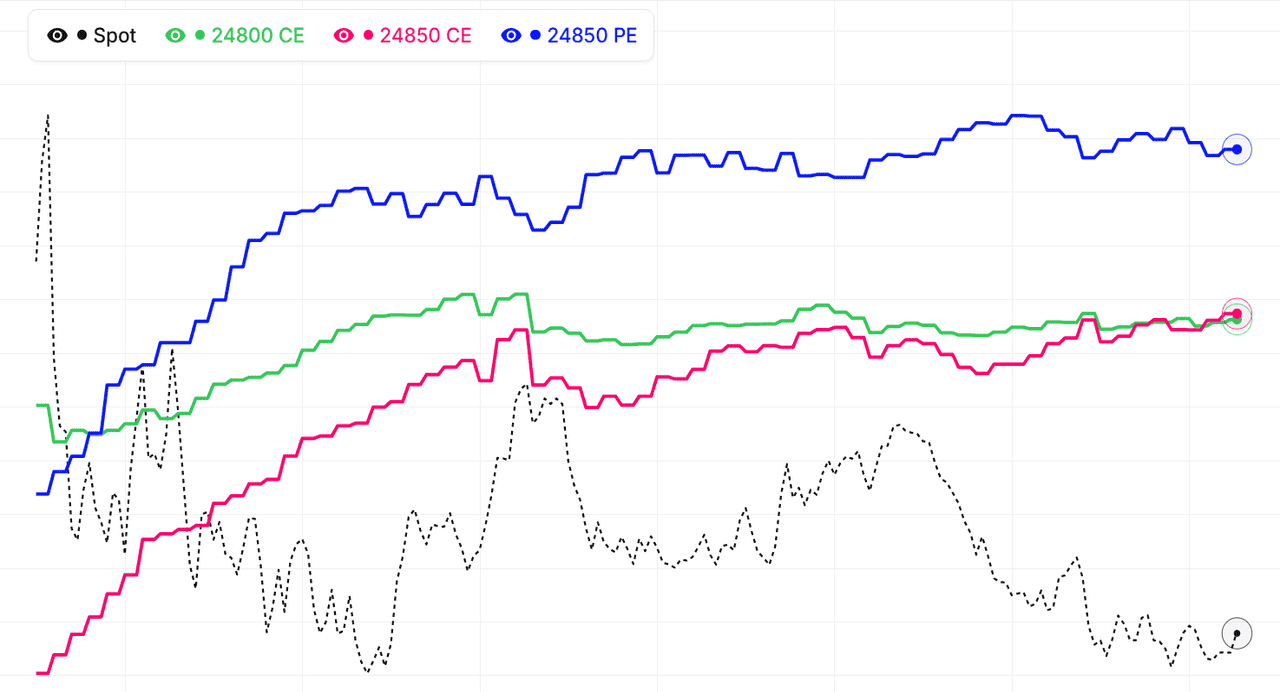
Open the tool, pick State Bank of India from the symbol selector, and choose an expiry — the nearest weekly carries the most intraday flow. Then choose how strikes get selected: High Volume loads the most actively traded strikes automatically, High OI loads the biggest positioning strikes, and Custom lets you hand-pick up to 10 calls and puts. Each strike gets its own coloured line; the dotted grey line is the SBIN future for price context.
What does the chart show?
The chart plots traded volume per strike through the session, with each selected strike as its own coloured line on a shared time axis. The dotted grey line is the SBIN future, so every volume spike can be read against what price was doing at that moment — useful for asking "when this strike spiked, was price testing a level or breaking it?"
Live vs historical mode for SBIN
Live mode streams today's SBIN option volume through market hours. Historical mode (for subscribers) replays any past trading day — pick a date and study how volume rotated across strikes before a move you remember. Replaying a handful of trending and range-bound State Bank of India days is the fastest way to train your eye for the patterns described here before risking money on them.
Switching between Volume and OI views
The OI/Volume toggle at the top of the chart switches the same strike selection between the Multi-Strike OI and Multi-Strike Volume tools. As of 17 September 2026, this is the recommended workflow: find the busy strikes in the volume view, then confirm in the OI view whether that activity is building real positions. Activity plus commitment is a level worth trading around; activity alone is just noise to be aware of.
State Bank of India (SBIN) Multi-Strike Volume: Finding Where the Market Is Active
Where does SBIN option volume concentrate during the day?
Most State Bank of India option volume concentrates at the at-the-money strike and the two or three strikes either side of it — that is where premiums are most responsive and where intraday traders operate. Volume at far OTM strikes is normally a small fraction of ATM volume. This baseline matters because deviations from it are the signal: when an outer strike starts drawing ATM-like volume, something has changed at that level.
When during the session is SBIN volume most informative?
The first hour (9:15–10:30 AM) shows overnight views being expressed — gaps get faded or chased, and the strikes drawing early volume reveal where positioning battles will happen. The midday lull is usually noise. The final hour matters again as institutions square or roll positions. Watching the multi-strike volume chart through these two windows gives you most of the day's information for a fraction of the screen time.
How does the High Volume auto-selection work for SBIN?
Instead of guessing which strikes matter, the tool can rank all SBIN strikes by traded volume and load the top N automatically. This surfaces the strikes the market itself has voted most important today — including ones you might not have thought to watch. You can adjust the count from 1 to 10 strikes, and the selection refreshes as you change symbol or expiry.
Using custom strikes for your own SBIN levels
If your trade plan is built around specific levels — yesterday's high, a gap fill, a round number — switch to custom selection and load exactly those strikes, calls and puts separately. As of 17 September 2026, you can overlay up to 10 strike series on the SBIN chart. The chart then becomes a live activity monitor for your personal levels rather than a generic market view.
SBIN multi-strike volume signals: quick reference
| Volume signal | OI behaviour | Common reading |
|---|---|---|
| Heavy volume at a strike | OI rising | Fresh positions being built; the level carries conviction |
| Heavy volume at a strike | OI falling | Positions unwinding; the level is being abandoned or breached |
| Heavy volume at a strike | OI flat | Intraday churn; common at the SBIN ATM strike on expiry day |
| Volume burst at a quiet strike | Not yet moved | Early warning the level is coming into play, before OI reacts |
| Volume rotating to higher call strikes | OI rising above spot | Bullish engagement; traders paying up for a breakout |
| Low volume at a strike | OI high | Stale positioning from earlier sessions; no fresh defence today |
Volume registers every trade instantly while open interest updates only as net positions change, so the SBIN volume chart above always leads. Pair any volume spike with its OI behaviour before treating it as a directional signal, and remember that expiry-day churn at the ATM strike inflates volume without conviction.
How to use Multistrike Volume
- Pick an underlying and expiry — Choose Nifty, BankNifty, or an F&O stock and select the expiry you want to analyze.
- Select strikes to compare — Use High Volume auto-selection to load the most actively traded strikes, or pick custom strikes around your key levels.
- Find where activity concentrates — Look for the strikes attracting the most call and put volume — these are the levels the market is actively trading and watching.
- Watch volume rotation in real time — As the session progresses, monitor whether volume migrates to higher or lower strikes. Rotation up the ladder = bullish engagement; down = bearish.
- Confirm with OI — Switch to the Multistrike OI view to check whether the volume is building positions (OI rising) or just churning (OI flat).
SBIN MultiStrike Volume — Frequently Asked Questions
What is SBIN MultiStrike Volume?
SBIN MultiStrike Volume chart shows traded option volume for multiple strikes on one view. This helps identify where market activity is concentrating and which levels traders are actively engaging.
How to interpret SBIN multi-strike volume data?
Watch for strikes with rapidly rising volume - these are the levels in play right now. Compare Call and Put volume across strikes, and confirm with open interest to see whether activity is building positions or just intraday churn.
What does high volume with flat OI mean at a SBIN strike?
High volume with flat open interest means contracts are changing hands intraday without new net positions being created — scalpers churning the strike. This is common at the SBIN ATM strike on expiry day and signals liquidity, not conviction. When volume and OI rise together at the same strike, fresh positions are being built and the level carries real weight.
Can I use SBIN multi-strike volume on expiry day?
Yes — expiry day is where the volume view works best. Open interest becomes hard to read as positions unwind, but volume shows which SBIN strikes the market is fighting over hour by hour. The strike attracting the most combined call and put volume in the final hours frequently acts as the settlement magnet.
How often does the SBIN multi-strike volume chart update?
During NSE market hours (9:15 AM to 3:40 PM IST) the SBIN multi-strike volume chart refreshes every minute from live option chain data. Outside market hours it shows the last traded session, and historical mode lets you replay how volume was distributed across SBIN strikes on any past expiry.