ICICIBANK Multi-Strike Option Volume | Live Volume Across Strikes
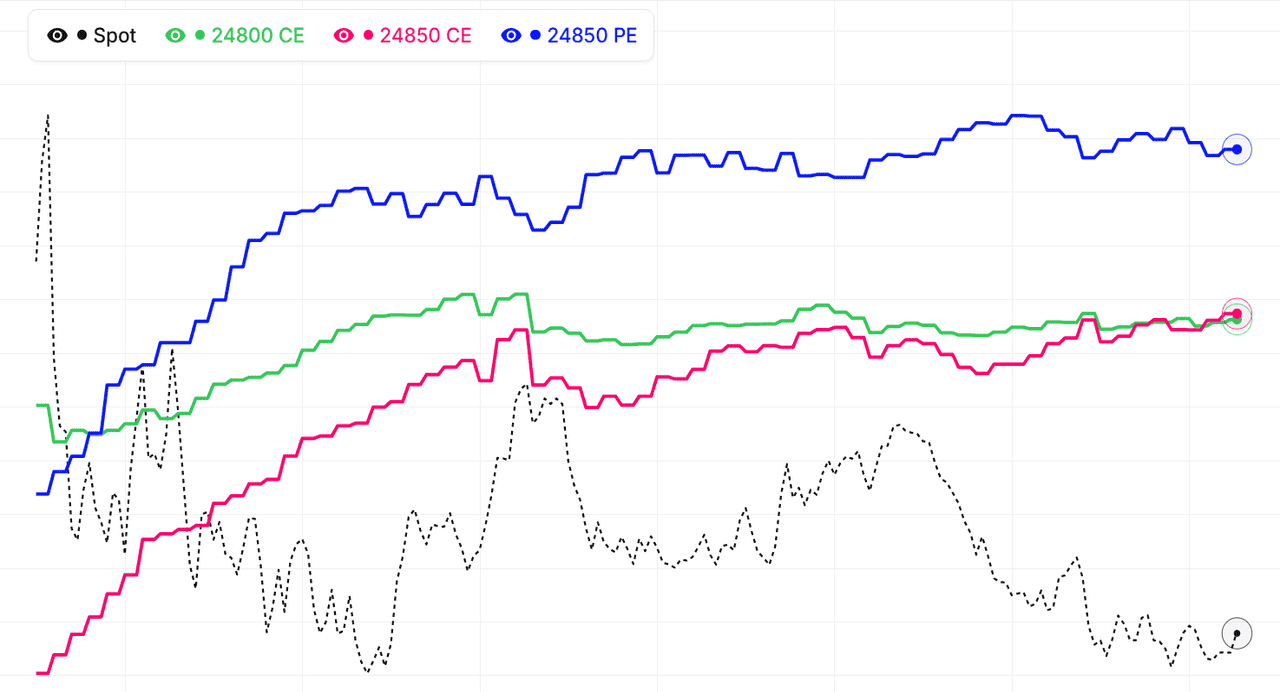
The multi-strike volume view for ICICIBANK shows traded option volume for several strikes on a single chart — the full activity footprint across the option chain instead of one strike at a time. This makes it easy to see where ICICIBANK option flow is concentrating: volume clustering at a strike means traders are actively engaging that level, while volume rotating to higher or lower strikes signals the market repositioning ahead of a directional move.
Every strike's volume curve for ICICIBANK can be added, removed, or hidden, so you can focus on the ATM band, your key support and resistance strikes, or specific far-OTM strikes you're watching for unusual activity, across all active expiries. Volume leads open interest — it registers every trade immediately, so activity shows up here before the OI chart confirms whether positions are being built.
Reading the ICICIBANK multi-strike volume footprint
A ICICIBANK strike showing heavy volume alongside rising open interest means new positions are being built with conviction. Heavy volume with flat OI is intraday churn — common at the ATM strike on expiry day. A sudden volume burst at a previously quiet strike is an early warning that the level is coming into play, often minutes before the OI reacts. Live mode keeps each strike's volume updated across the NSE session.
Combine multi-strike volume with our Multi-Strike OI, Total OI Chart, and Live Option Chain to build a full picture of ICICIBANK NSE option-market activity.
ICICI Bank Ltd (ICICIBANK) Multi-Strike Volume: Confirming Breakouts with Option Flow
How does option volume confirm a ICICIBANK breakout?
A genuine ICICI Bank Ltd breakout is usually accompanied by aggressive option volume at and above the breakout level — call buyers paying market prices to participate while the move happens. If ICICIBANK crosses a resistance level on thin option volume, the move lacks sponsorship and is more likely to fade. The multi-strike volume chart lets you verify participation in real time: when price breaks a level, check whether volume at the strikes around that level is surging or shrugging.
What does volume rotation up the strike ladder mean?
When the heaviest call volume shifts from one ICICIBANK strike to the next higher strike, and then the next, traders are chasing the move and repositioning for more upside. This ladder rotation is one of the earliest confirmations that a trend day is developing. The reverse — put volume rotating to lower strikes — signals the same thing on the downside. On the multi-strike chart this shows up as successive volume curves steepening one after another.
Can volume warn of a false breakout on ICICIBANK?
Yes, and this is one of the most practical uses. If ICICI Bank Ltd pokes above resistance but call volume at the strikes overhead stays flat while put volume picks up, option traders are fading the move rather than joining it. False breakouts on ICICIBANK frequently show this signature: price making new session highs while the option market quietly positions against it. Spotting the divergence early can save you from buying the top.
Which strikes should I load for breakout monitoring?
Load the breakout strike itself plus two or three strikes above it (for upside breaks) or below it (for downside breaks), both calls and puts. As of 17 September 2026, you can do this with the custom strike selector — pick the exact levels that matter to your trade instead of relying on defaults. Watch the cluster as price approaches the level: rising volume into the test is participation; silence is a warning.
ICICI Bank Ltd (ICICIBANK) Option Volume: Spotting Unusual Activity
What counts as unusual option volume on ICICIBANK?
Unusual activity is volume out of proportion to a strike's normal share of the day's flow — a far OTM ICICI Bank Ltd strike trading like an ATM strike, or a quiet midday session suddenly printing a burst at one level. Because the multi-strike chart shows several strikes on a common scale, disproportion is visible immediately: one line steepening while its neighbours stay flat. On a single-strike view the same event would look unremarkable.
Who creates these volume bursts on ICICIBANK?
Large hedging programs, institutional desks rolling positions, and occasionally traders acting ahead of news. You usually cannot know which, and it does not matter much — what matters is that a well-capitalised participant just decided that ICICIBANK level is important. The strike becomes a marker: watch how price behaves when it approaches, and watch whether OI at the strike confirms a position was built.
How should I react to a burst at a ICICIBANK strike?
Do not chase it blindly. First check the OI view: if OI jumped with the volume, a position was established and the strike is now a genuine level. Second, check both sides — a call-volume burst paired with an equal put-volume burst at the same strike is likely a straddle or volatility trade, not a directional bet. Third, note the time: bursts in the last 30 minutes are often just position squaring and rarely carry overnight information.
Monitoring ICICIBANK for bursts efficiently
As of 17 September 2026, a practical approach is to keep the High Volume auto-selection running with 8–10 strikes — the selection itself flags newly busy strikes by pulling them into the chart, and fresh activity shows up as a steep, obvious spike. That gives you a passive unusual-activity monitor for ICICI Bank Ltd without paying for a separate flow-scanning service.
ICICI Bank Ltd (ICICIBANK) Volume Analysis: Call vs Put Activity Across Strikes
What does the Call vs Put volume view show for ICICIBANK?
The Call vs Put mode aggregates volume across all your selected ICICI Bank Ltd strikes into two lines: total call volume and total put volume. This strips out strike-level detail and answers a simpler question — which side of the ICICIBANK option market is more active right now? Persistent call-volume dominance during an up-move confirms participation; put volume swelling while price is flat often front-runs weakness.
Is heavy call volume on ICICIBANK bullish or bearish?
By itself, neither — every option trade has a buyer and a seller. Heavy call volume during a rising market with rising call premiums suggests aggressive call buying (bullish). The same volume with falling premiums suggests call writing into strength (bearish positioning by sellers). Volume tells you where the fight is; premium direction and OI change tell you who is winning. The multi-strike tools give you all three within a click of each other.
How do I spot a sentiment shift in ICICIBANK intraday?
Watch the gap between the call and put volume curves. Through a typical ICICI Bank Ltd session, the curves rise roughly in parallel. A sentiment shift shows up as one curve accelerating away from the other — put volume suddenly compounding faster than call volume, for instance, often marks the moment intraday sentiment flips even if price has not broken down yet. It is a leading read precisely because it measures urgency, not price.
Combining the aggregate and individual views on ICICIBANK
A practical routine as of 17 September 2026: run Call vs Put mode for the session-level read, and when the aggregate shifts, switch to Individual mode to find which specific strikes are driving the change. If the put-volume surge is concentrated at one strike just below spot, it is likely a defended level; if it is spread across many strikes, it reads as broader hedging demand on ICICIBANK.
ICICIBANK multi-strike volume signals: quick reference
| Volume signal | OI behaviour | Common reading |
|---|---|---|
| Heavy volume at a strike | OI rising | Fresh positions being built; the level carries conviction |
| Heavy volume at a strike | OI falling | Positions unwinding; the level is being abandoned or breached |
| Heavy volume at a strike | OI flat | Intraday churn; common at the ICICIBANK ATM strike on expiry day |
| Volume burst at a quiet strike | Not yet moved | Early warning the level is coming into play, before OI reacts |
| Volume rotating to higher call strikes | OI rising above spot | Bullish engagement; traders paying up for a breakout |
| Low volume at a strike | OI high | Stale positioning from earlier sessions; no fresh defence today |
Volume registers every trade instantly while open interest updates only as net positions change, so the ICICIBANK volume chart above always leads. Pair any volume spike with its OI behaviour before treating it as a directional signal, and remember that expiry-day churn at the ATM strike inflates volume without conviction.
How to use Multistrike Volume
- Pick an underlying and expiry — Choose Nifty, BankNifty, or an F&O stock and select the expiry you want to analyze.
- Select strikes to compare — Use High Volume auto-selection to load the most actively traded strikes, or pick custom strikes around your key levels.
- Find where activity concentrates — Look for the strikes attracting the most call and put volume — these are the levels the market is actively trading and watching.
- Watch volume rotation in real time — As the session progresses, monitor whether volume migrates to higher or lower strikes. Rotation up the ladder = bullish engagement; down = bearish.
- Confirm with OI — Switch to the Multistrike OI view to check whether the volume is building positions (OI rising) or just churning (OI flat).
ICICIBANK MultiStrike Volume — Frequently Asked Questions
What is ICICIBANK MultiStrike Volume?
ICICIBANK MultiStrike Volume chart shows traded option volume for multiple strikes on one view. This helps identify where market activity is concentrating and which levels traders are actively engaging.
How to interpret ICICIBANK multi-strike volume data?
Watch for strikes with rapidly rising volume - these are the levels in play right now. Compare Call and Put volume across strikes, and confirm with open interest to see whether activity is building positions or just intraday churn.
What does high volume with flat OI mean at a ICICIBANK strike?
High volume with flat open interest means contracts are changing hands intraday without new net positions being created — scalpers churning the strike. This is common at the ICICIBANK ATM strike on expiry day and signals liquidity, not conviction. When volume and OI rise together at the same strike, fresh positions are being built and the level carries real weight.
Can I use ICICIBANK multi-strike volume on expiry day?
Yes — expiry day is where the volume view works best. Open interest becomes hard to read as positions unwind, but volume shows which ICICIBANK strikes the market is fighting over hour by hour. The strike attracting the most combined call and put volume in the final hours frequently acts as the settlement magnet.
How often does the ICICIBANK multi-strike volume chart update?
During NSE market hours (9:15 AM to 3:40 PM IST) the ICICIBANK multi-strike volume chart refreshes every minute from live option chain data. Outside market hours it shows the last traded session, and historical mode lets you replay how volume was distributed across ICICIBANK strikes on any past expiry.