FINNIFTY Vega Analysis | Live Call & Put Vega
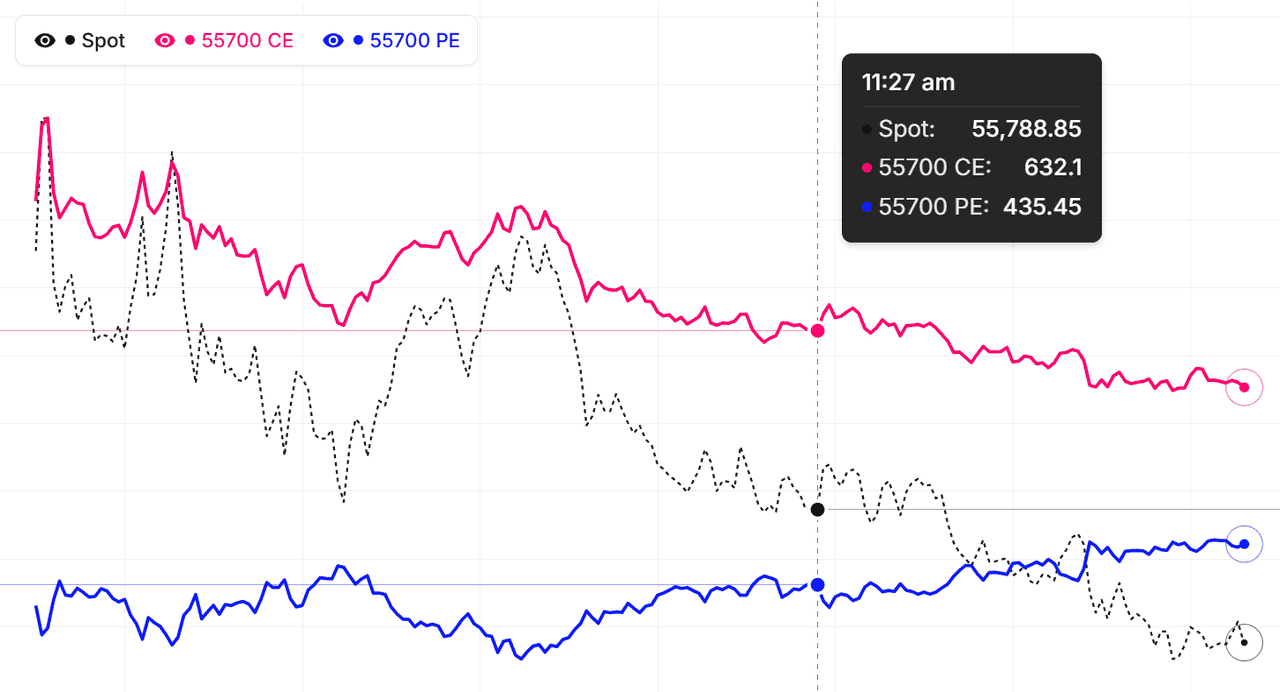
Vega Analysis for FINNIFTY plots total Call Vega and total Put Vega across a band of strikes around the money. For every minute it solves implied volatility from each option's traded price, reads the vega, and sums the calls into one line and the puts into another — so you can see how FINNIFTY volatility exposure builds and unwinds through the session.
Because each FINNIFTY call and put trades at its own implied volatility, the two vega lines diverge with the skew. A put-vega line above call-vega reflects downside-fear skew; call-vega leading points to upside-volatility demand. Live mode streams every selected FINNIFTY strike in real time.
Using FINNIFTY vega in context
Pair Vega Analysis with our Volatility Skew, IV Chart, and Multi-Strike Chart tools for richer FINNIFTY volatility analysis on NSE.
Strikes re-centre on the latest-minute ATM
Nifty Financial Services (FINNIFTY) Vega: Why Calls and Puts Diverge
Shouldn't a call and put have the same vega?
In the textbook Black-Scholes model, a call and a put at the same strike and the same implied volatility have identical vega. In the live FINNIFTY market they do not, because the call and put at a strike trade at different implied volatilities — the volatility skew. Vega is derived from each option's own market price, so the call-side and put-side vega lines for Nifty Financial Services separate exactly to the degree the skew is present.
What a widening gap tells you on FINNIFTY
When put vega pulls away from call vega, demand for downside protection is bidding up put implied volatility — a defensive, risk-off tone. When call vega leads, upside-volatility demand is dominating, which can accompany momentum or short-covering. Tracking the gap intraday on Nifty Financial Services gives an early, price-independent read on positioning.
Combining vega with skew tools
Pair Vega Analysis with the Volatility Skew and IV Chart views for FINNIFTY. Skew shows the IV shape across strikes at a moment; Vega Analysis shows how the aggregate call/put volatility exposure built up and unwound through the session. Together they explain both the level and the time dynamics of Nifty Financial Services volatility.
Nifty Financial Services (FINNIFTY) Vega Through the Trading Day
Opening hour vega on FINNIFTY
Right after the open, Nifty Financial Services implied volatility and therefore aggregate vega are often elevated as overnight risk gets repriced. The Call and Put Vega lines can start wide and then converge as the session settles. This early window is where volatility sellers see the richest premium and buyers pay the most.
Mid-session decay
Through the quiet midday hours, FINNIFTY vega typically grinds lower as implied volatility softens and time passes. Both lines drifting down together signals an orderly, range-bound tape. A sudden vega spike against this backdrop usually flags news or a positioning shock worth investigating.
Into the close
In the final hour, institutional hedging can move Nifty Financial Services implied volatility sharply, and the vega lines with it. A late jump in put vega often reflects downside hedging into the next session. Reviewing the full-day vega shape as of 13 October 2026 helps you anticipate how rich or cheap volatility will open tomorrow.
Nifty Financial Services (FINNIFTY) Vega Analysis: Intraday Volatility Exposure
What is the FINNIFTY Vega Analysis tool?
Vega Analysis plots two intraday lines for Nifty Financial Services (FINNIFTY) — total Call Vega and total Put Vega across a band of strikes around the money. For every minute of the session it solves implied volatility from each option's traded price, reads that option's vega, then adds up the vega of all selected calls into one line and all selected puts into another. As a major Financial Services index on NSE, Nifty Financial Services near-ATM strikes are liquid enough for this minute-by-minute read to stay meaningful.
Why vega matters for FINNIFTY option traders
Vega measures how much an option's premium changes for a one percentage-point move in implied volatility. If you are long FINNIFTY options you are long vega and benefit when IV rises; if you are short premium you are short vega and want IV to fall. Watching aggregate vega through the day shows when your volatility exposure is largest — typically near ATM and earlier in the expiry cycle — and when it decays away.
Reading the two lines
Because the tool sums calls and puts separately, the gap between the Call Vega and Put Vega lines is itself a signal. A persistent gap reflects volatility skew — the market pricing call-side and put-side risk differently. As of 13 October 2026, watch whether the FINNIFTY put-vega line sits above the call-vega line (downside-fear skew) or below it.
FINNIFTY vega by strike zone: quick reference
| Strike zone | Vega concentration | If IV rises +1% | If IV falls −1% |
|---|---|---|---|
| ATM (at the money) | Peak vega — most IV-sensitive | Largest premium gain for long options | Largest premium loss (IV crush) |
| Near-money (±1–2 strikes) | High, tapering off ATM | Meaningful premium lift on FINNIFTY | Meaningful premium erosion |
| Far OTM / ITM (±3–4 strikes) | Low to moderate | Modest premium change | Modest premium change |
| Deep wings | Negligible vega | Little reaction to IV | Little reaction to IV |
Vega is largest at the money and in longer-dated expiries, so ATM FINNIFTY options move most when implied volatility shifts. Ahead of events — the Budget, an RBI decision, or results — IV inflates and lifts vega across strikes; the post-event IV crush then reverses it. The live chart above splits Call and Put Vega so you can see which side's volatility exposure is building.
How to use Vega Analysis
- Pick the underlying — Choose Nifty, BankNifty, or any F&O stock from the symbol selector.
- Choose live or historical — Live streams the current session. Historical lets you replay a past trading day.
- Select the expiry — Pick the expiry whose strikes you want to analyse.
- Set the ATM range — Choose how many strikes around ATM to include (ATM ± 1 up to ATM ± 4). Both call and put are included for each strike.
- Read the two vega lines — Watch total Call Vega vs total Put Vega through the day. A widening gap signals call/put volatility-exposure imbalance driven by skew.
FINNIFTY Vega Analysis — Frequently Asked Questions
What is FINNIFTY Vega Analysis?
FINNIFTY Vega Analysis plots two intraday lines — total Call Vega and total Put Vega across a band of strikes around ATM — by solving implied volatility from each option's traded price and summing its vega. It shows how FINNIFTY option volatility exposure evolves through the session.
Why do FINNIFTY Call Vega and Put Vega differ?
A call and put at the same strike share the same vega only at the same implied volatility. In the FINNIFTY market each trades at its own IV (the skew), so the call-side and put-side vega lines diverge — a direct, price-independent read on volatility positioning.
Which FINNIFTY strikes carry the most vega?
Vega peaks at the at-the-money strike and tapers toward deep in- and out-of-the-money strikes, so ATM FINNIFTY options are the most sensitive to implied-volatility moves. Longer-dated expiries also carry more vega than weekly ones, which is why the chart windows strikes tightly around ATM to capture the bulk of the exposure.
What happens to FINNIFTY options when IV rises or falls?
Vega measures how much an option's price moves for a one-point change in implied volatility. When IV rises, both FINNIFTY calls and puts gain premium; when IV falls — the classic post-event IV crush — long options lose value even if spot is unchanged. ATM positions feel this the most.
How often does the FINNIFTY Vega Analysis chart update?
During NSE market hours (9:15 AM to 3:40 PM IST) the FINNIFTY Vega Analysis chart refreshes every minute, recomputing Call and Put Vega from live option prices. Outside market hours it shows the last session, and Historical mode replays intraday vega for any past FINNIFTY trading day.
Learn more
Read our guide: Option Greeks Explained: Delta, Gamma, Theta, Vega & Rho