Live PE-CE Open Interest Difference — Sentiment Gauge for Nifty & BankNifty
No data |
Nifty 50 (NIFTY) PE-CE Difference: Magnitude Matters
Why the magnitude of the difference matters on NIFTY
A difference of +1 lakh is small; +10 lakh is significant. The larger the difference, the stronger the signal. Large differences indicate real conviction — one side has meaningfully more commitment than the other. For Nifty 50, watching magnitude alongside direction gives more reliable signals.
What counts as a large difference for NIFTY
For Nifty 50, what counts as "large" depends on typical OI levels. For NIFTY and BANKNIFTY, differences of 20+ lakh are large. For stock options, differences of 2-5 lakh can be significant. Build your sense of normal magnitudes by observing the chart over a few weeks.
Small differences on NIFTY
A small PE-CE Difference means the market is relatively balanced. Neither bulls nor bears dominate. These environments favour range-bound strategies because the lack of conviction reduces the probability of large directional moves. Iron condors and strangles work well in these conditions.
Using magnitude for position sizing as of 13 October 2026
Larger differences justify larger positions because conviction is higher. Smaller differences warrant smaller positions or skipped trades. Let magnitude drive sizing decisions. This dynamic approach naturally concentrates capital on the strongest setups and reduces exposure during uncertain periods on NIFTY.
Nifty 50 (NIFTY) PE-CE Difference: Extreme Readings
What counts as extreme for NIFTY
Extreme PE-CE Difference readings are those far above or below typical ranges. For Nifty 50, extreme highs might be 30+ lakh positive (heavy put OI dominance) or 30+ lakh negative (heavy call OI dominance). These extremes are rare and usually signal the market is crowded on one side.
Trading extreme high PE-CE on NIFTY
An extremely high positive PE-CE Difference means put writers are very committed. In the short term, this is bullish — the support is strong. In the longer term, extreme readings often mean the bullish trade is crowded and due for a contrarian reversal. Use these extremes carefully and combine with other signals.
Trading extreme low PE-CE on NIFTY
Extreme negative readings mean call writers dominate heavily. Short-term this is bearish. Long-term it may be a contrarian bullish setup because the bearish trade is crowded. Again, combine with other signals to decide which interpretation fits current conditions.
Timing extreme trades as of 13 October 2026
Do not enter at the first extreme reading — extremes can deepen. Wait for the first sign of mean reversion before taking contrarian positions. This patience reduces false starts and improves entry quality on NIFTY.
Nifty 50 (NIFTY) PE-CE Difference: Range-Bound Analysis
Range-bound PE-CE patterns on NIFTY
In range-bound conditions, PE-CE Difference typically oscillates within a narrow band. Neither side dominates for long. The chart shows regular crossings of the zero line as sentiment flips back and forth. This pattern confirms the market is in equilibrium.
Trading ranges using PE-CE
In range conditions, premium selling works best. Short strangles or iron condors profit from the lack of directional conviction. Use the chart to confirm the range is stable. If PE-CE starts trending strongly, the range may be about to break — exit short premium trades.
Range breakout warnings on NIFTY
When PE-CE Difference starts trending decisively (rather than oscillating), the range is ending. A sustained positive trend means bullish breakout is coming. A sustained negative trend means bearish breakdown. Early recognition of the trend gives you an edge on range traders who only watch price.
Strategy adjustment as of 13 October 2026
Adapt strategies to the current regime. Range-bound: sell premium. Trending: directional trades or momentum plays. The PE-CE Difference chart tells you which regime is active. Avoid fighting the regime — it is much easier to profit by aligning with it.
About PE-CE OI Difference
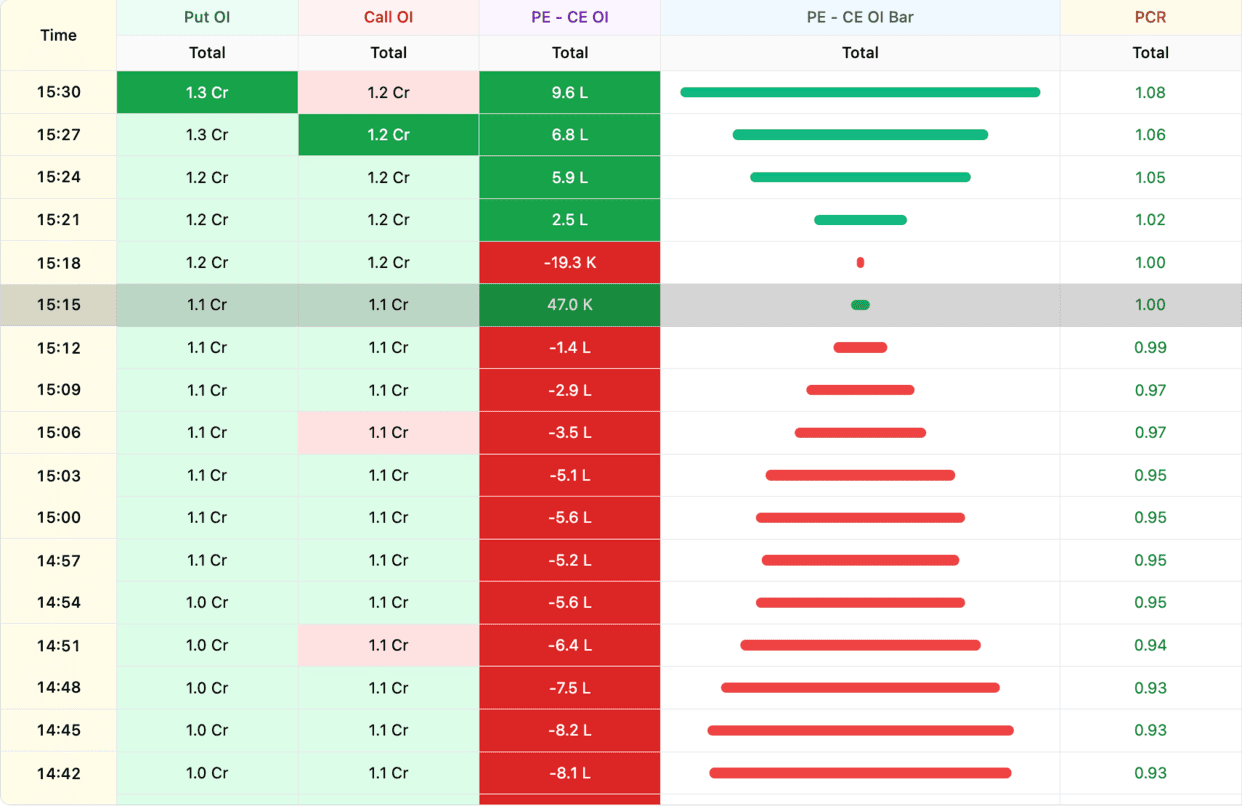
PE minus CE open interest is one of the simplest yet most directional sentiment gauges in Indian F&O. It subtracts total call OI from total put OI across the Nifty, BankNifty, or any F&O stock option chain. A positive difference means more puts are being written. A negative difference means more calls are being written. Because writers are predominantly institutional, the sign and magnitude reveal where professional money is committing capital.
A sharply rising PE-CE difference through the session is a real-time bullish signal. Put writers are defending lower strikes with increasing conviction. A falling or deeply negative difference is bearish positioning. The speed of the change matters too: a gradual drift reflects steady accumulation, while a sharp flip usually follows a surprise macro or stock-specific event and signals a regime change. We chart PE-CE as a time series so the shifts are obvious, and break it down per expiry so weekly and monthly positioning never get conflated.
Trading with PE-CE difference
Option sellers use PE-CE to pick the right side to write. When the difference is heavily positive, OTM puts tend to hold and are safer to sell than OTM calls. Directional traders use the intraday slope. A steepening positive slope in the first hour is one of the most reliable bullish confirmations the option chain gives. Reversals in the slope often precede reversals in spot by 15-30 minutes, which makes PE-CE a useful early-warning indicator during trending sessions.
Combine PE-CE difference with our Call vs Put OI Chart, PCR Tracker, and Open Interest Analysis for a fuller NSE F&O sentiment picture.
PE-CE Difference: Video Walkthrough
How to read the PE-CE Difference chart
- Select symbol and expiry — Pick Nifty, BankNifty, or an F&O stock. Check both weekly and monthly expiries separately.
- Check the sign — Positive (put OI > call OI) is bullish bias. Negative is bearish bias. Zero is balanced.
- Watch the slope — Rising means puts being written faster (bullish). Falling means calls being written faster (bearish). Slope direction matters more than absolute level.
- Identify first-hour trend — The first hour of trade usually sets the day's PE-CE direction. A clear slope by 10:30 IST often dictates intraday bias.
- Look for slope reversals — Sharp flips in slope (bullish to bearish or vice versa) often precede price reversals by 15-30 minutes.
Frequently Asked Questions
What does PE-CE OI difference measure?
PE-CE difference is total put open interest minus total call open interest across the option chain. A positive and rising value means puts are being written faster than calls — bullish institutional positioning. A negative and falling value is the opposite — bearish positioning. It's a single-line sentiment gauge built from the entire chain.
How is this different from PCR?
PCR divides put OI by call OI (a ratio). PE-CE difference subtracts them (an absolute number). The subtraction is more sensitive to large moves on one side; the ratio normalises for total OI level. Both are useful — PCR for regime identification, PE-CE difference for intraday slope changes.
What does the slope of PE-CE tell me intraday?
The slope — how fast PE-CE is rising or falling through the session — is often more informative than the absolute level. A steepening positive slope in the first hour of Nifty trade is one of the most reliable bullish confirmations. A sharp slope flip mid-session is a reliable regime-change warning.
Does PE-CE work for single-stock F&O?
Yes, and often with cleaner signals than indices because stock-specific OI tends to be concentrated at fewer strikes. For names like Reliance, HDFC Bank, or ICICI Bank, watching PE-CE difference ahead of results or sectoral events reveals institutional positioning clearly.
What's the difference between PE-CE at different expiries?
Weekly expiry PE-CE reflects short-term positioning; monthly expiry PE-CE shows deeper institutional commitment. They often disagree — weekly may be neutral while monthly is strongly bullish, or vice versa. Checking both expiries gives a complete positioning picture rather than just the near-term noise.
How do I combine PE-CE with price action?
Treat PE-CE as the leading indicator and price as the confirmation. A steepening positive PE-CE trend with price also rising is a high-conviction bullish setup. PE-CE rising but price stalling can indicate traders are positioning ahead of a breakout not yet visible. PE-CE rising while price is falling is a contrarian signal — institutions writing puts into weakness.
Learn more
Read our guide: What Is Open Interest in Options? A Trader's Guide