Historical Option Chain Replay — Time-Series Strike & OI Snapshots for NSE F&O
No data |
(NIFTY) Timeseries Option Chain: Data Quality
How accurate is historical NIFTY data?
Historical option chain data in the Timeseries tool comes from NSE's official feeds. It is the same data the exchange uses for clearing and settlement, meaning it is highly accurate. What you see in historical mode is what actually happened on those trading days, not estimated or reconstructed values.
Understanding data granularity
Depending on the tool and the date, historical data may be available at different granularity — end-of-day snapshots, hourly snapshots, or minute-by-minute ticks. Intraday patterns are only visible in higher-granularity data. For quick overviews, end-of-day is enough. For detailed pattern study, higher granularity is better.
Data coverage for NIFTY
Traded on NSE, has extensive historical options data going back multiple years. This deep archive supports thorough pattern study. Less active symbols may have thinner historical data. Check the tool's date range to understand what is available for your specific NIFTY analysis.
Data limitations as of 1 July 2026
Data only reflects what actually happened — it does not show what hypothetical alternative scenarios would have produced. It also does not eliminate hindsight bias; you know what happened next when reviewing. Be honest about this bias when drawing lessons from historical data for future decisions.
(NIFTY) Timeseries Option Chain: Pro Tips
Tip 1: compare today to past similar days on NIFTY
Every morning, pull up the Timeseries tool and find a past day with similar conditions to today. Similar position in expiry cycle, similar IV, similar market direction. Studying how that day unfolded gives you informed expectations for today. It takes 2-3 minutes but adds meaningful context.
Tip 2: build a pattern playbook
Document the patterns you find across many historical sessions. "Setup X led to outcome Y in 8 out of 12 cases." "Pattern Z failed in volatile weeks but worked in calm weeks." These documented observations become your personal playbook, more valuable than any generic trading guide.
Tip 3: review your trades historically on NIFTY
For every significant trade you take, later review what the option chain looked like at your entry time. Use the Timeseries tool to see the exact conditions. Honest review of your trade decisions — both winners and losers — is how you improve fastest. The tool makes this review easy.
Tip 4: stay consistent as of 1 July 2026
Historical study compounds over time. A trader who spends 20 minutes weekly for a year has done 17 hours of focused study on option patterns — far more than most retail traders. This sustained effort produces real edge. Generic guides teach theory; disciplined historical study teaches reality. Traded on NSE, rewards the trader who commits to learning from the past.
About the Timeseries Option Chain
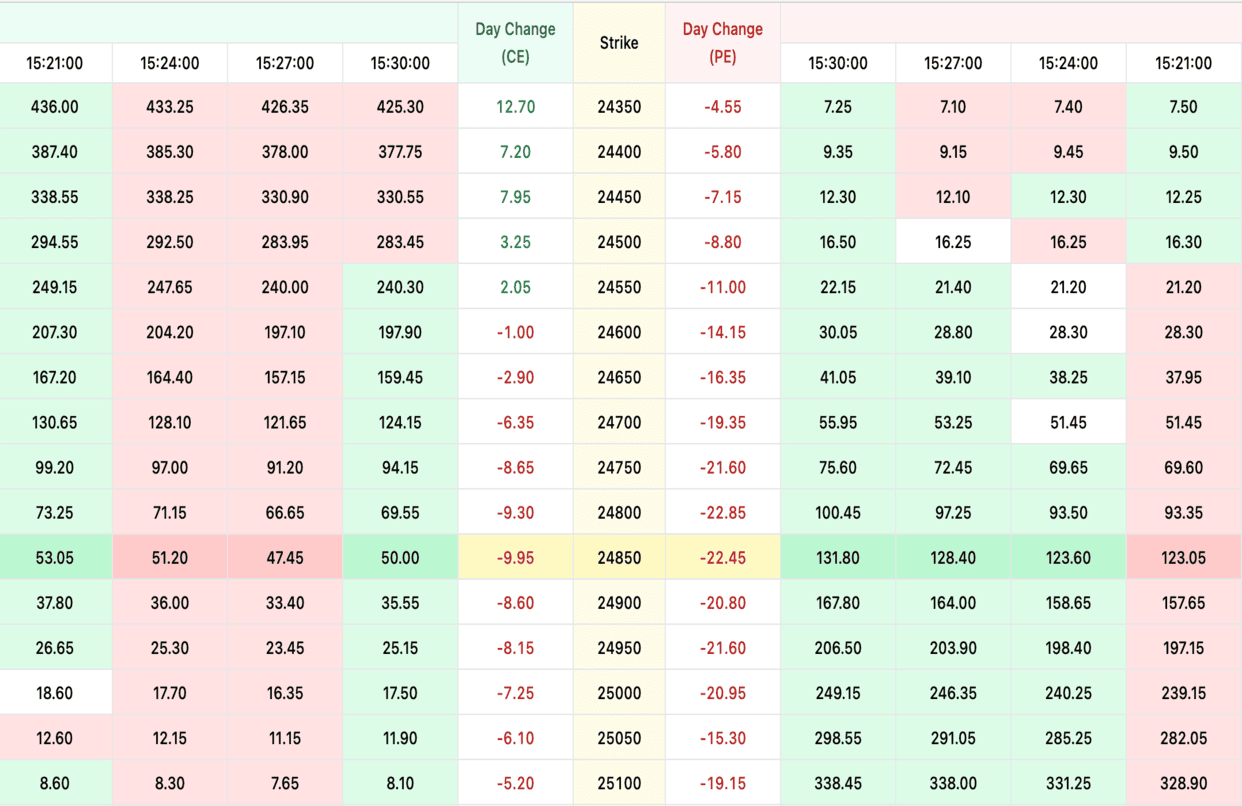
A research-grade replay tool for the NSE option market. Pick any past trading date and any minute inside that session. The full option chain renders exactly as it looked live, strike by strike. OI, volume, premium, implied volatility, Greeks. Captured as they streamed through NSE. You can scrub through a full session and watch how institutional positioning evolved in Nifty, BankNifty, or any F&O stock minute by minute.
This is the tool serious option traders use for back-testing and post-mortem. Back-test strategies on true intraday data instead of close-only prices. Study how max pain shifted in the final week of a monthly expiry. Reconstruct OI buildup around budget day, RBI policy, or an earnings announcement. Journal an old trade with the exact chain conditions you were looking at when you entered. The data is what traders saw live, not a reconstruction. So your conclusions sit on actual market state, not smoothed estimates.
Practical research workflows
Systematic traders build back-tests that iterate across hundreds of expiries and spot checks, using the minute-level chain to simulate realistic entries and exits. Discretionary traders use the replay to study specific past setups ("how did the chain behave on the day of the last RBI decision?") instead of relying on memory. Educators use it to walk students through real intraday option flow rather than sanitised examples.
Pair the timeseries chain with our Live Option Chain, Max Pain Calculator, and Open Interest Analysis for fuller NSE option-market research.
Frequently Asked Questions
What does the Timeseries Option Chain actually let me do?
Pick any past trading date, pick any minute inside that session, and the full NSE option chain renders the way it looked live at that moment. Strike-by-strike OI, premiums, volumes, IV, and Greeks. You can scrub through a session like a video. Most option research either works on end-of-day prices or relies on memory; this gives you the actual minute-level state.
How far back does the historical data go?
Multiple years for Nifty, BankNifty, FinNifty and the major F&O stocks. Coverage thins for stocks that joined the F&O segment recently. The minimum granularity is 1-minute snapshots throughout the session, not just open and close.
Is this data exact, or smoothed?
Exact. We archive the live NSE feed as it streams, so the OI you see at 11:42 IST on a given day is what was actually printed at 11:42 IST. Nothing is interpolated or estimated. That matters a lot for back-testing — most public datasets use end-of-day or 5-minute resamples, which destroy the intraday behaviour that option strategies actually live or die on.
Can I back-test option strategies with this?
Yes, and it's the main reason serious traders use the tool. Iron condors, short straddles, weekly directional plays — all of them depend on intraday entry and exit timing. Back-testing on real minute-by-minute chains is closer to live conditions than anything you'll get from EoD data. Educators also use the replay to walk students through historical events like the 2024 election counting day or RBI surprise cuts.
Does the replay show Greeks and IV correctly?
Yes. IV is recomputed for every snapshot from the live premium and spot of that exact moment. Greeks are derived consistently. Worth knowing: deep ITM and far OTM options can have noisy IV right around the open and close, which is a real-data quirk, not a tool bug.
What's a practical use case I might not have thought of?
Trade journaling. After a losing trade, replay the chain at the moment you entered. Was the IV abnormal? Was the OI shifting against you and you missed it? Was max pain already moving away from your strike? Reviewing trades against the actual chain conditions is one of the fastest ways to improve as an option trader.
How to use the Timeseries Option Chain
- Pick a symbol and a past date — Choose Nifty, BankNifty, or any F&O stock. Pick the trading date you want to study from the calendar.
- Choose the expiry to inspect — Weekly expiries replay differently from monthly. Match the expiry that was live on the date you picked.
- Scrub through the session — Use the time slider or playback controls to move minute by minute. Watch how OI, premium, and IV evolved through the day.
- Pause at the moments that matter — Stop at the 9:15 open, RBI announcement window, FII data release, or any moment that mattered to your trade. Read the chain as it was.
- Cross-reference with max pain or smart OI — Open the same date in our Max Pain or Smart OI tools to see how those signals were behaving alongside the chain.