ICICIBANK Put Call Ratio (PCR) Chart | Live NSE Sentiment
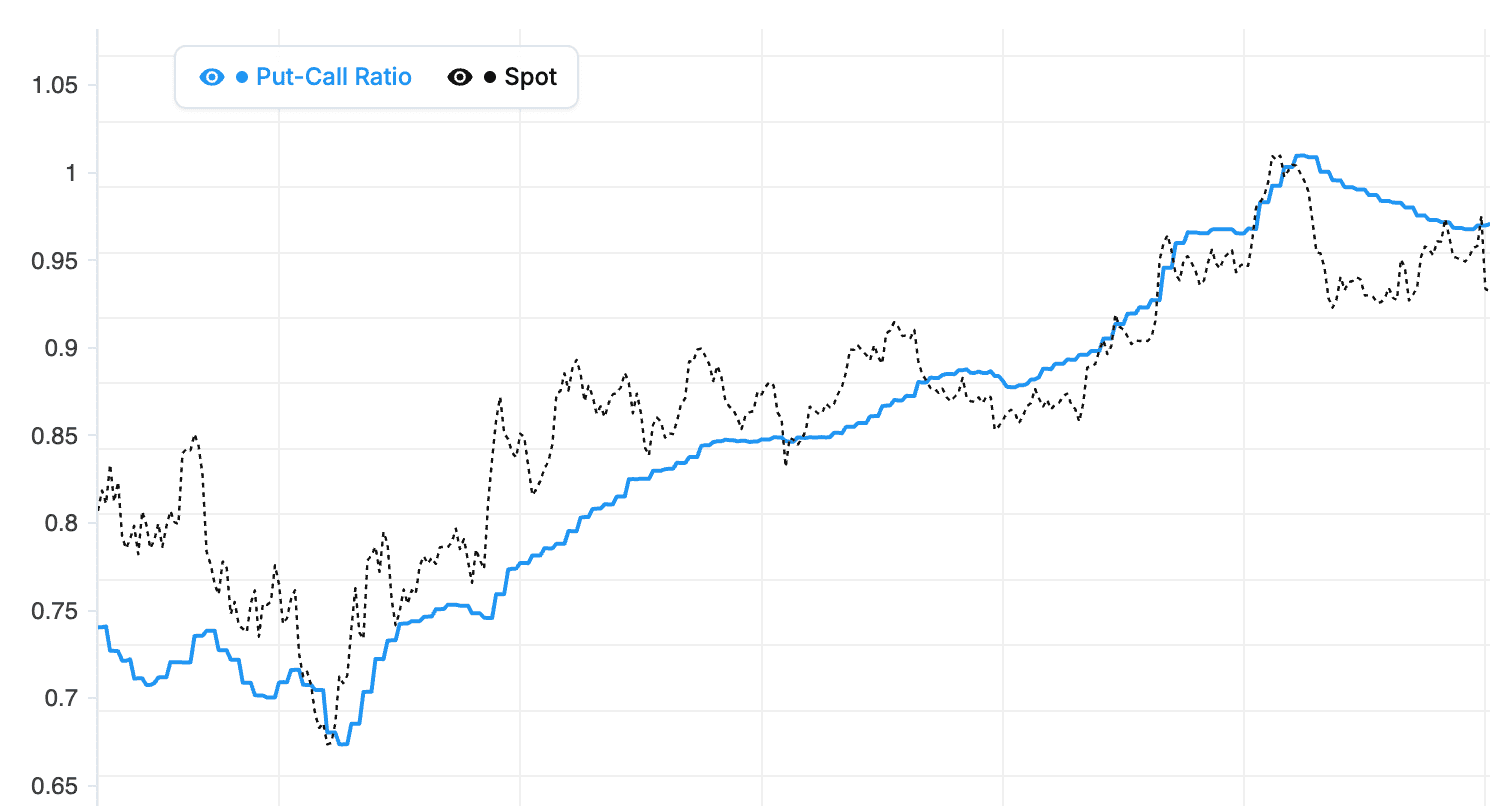
Put Call Ratio (PCR) for ICICIBANK is a core sentiment indicator built from the live option chain. It divides total put open interest by total call open interest. Higher values mean more puts are being written relative to calls, which Indian F&O traders read as bullish positioning by institutions who are defending lower strikes. Lower PCR readings mean calls are accumulating faster, typically a cautious or bearish stance on ICICIBANK.
Our tool tracks ICICIBANK PCR every minute across all active expiries on NSE. You can view PCR as a time-series chart to see how sentiment is evolving through the session, compare weekly vs monthly expiry PCR (they often diverge around event risk), and overlay the underlying price to see where PCR leads or lags the market. Historical mode lets you replay PCR on any past ICICIBANK expiry to study how it behaved around results, RBI announcements, or major global events.
Reading ICICIBANK PCR levels
As a general guide on ICICIBANK: PCR below 0.7 signals heavy call writing and bearish tilt, 0.7 to 1.0 is a neutral-to-mildly-bearish zone, 1.0 to 1.3 is neutral-to-bullish, and above 1.3 signals strong put writing and bullish institutional positioning. But PCR turns contrarian at extremes. A PCR above 1.8 on ICICIBANK often marks exhaustion bullishness that leads to sharp reversals, and a PCR below 0.5 often marks capitulation bearishness that gets bought.
Use PCR alongside our Max Pain Calculator, Call vs Put OI Chart, and Open Interest Analysis to build a complete view ofICICIBANK option-market positioning each trading session.
ICICI Bank Ltd (ICICIBANK) PCR Normal Range and Extreme Readings
What is the normal PCR range for ICICIBANK?
Historically, ICICI Bank Ltd PCR oscillates between roughly 0.8 and 1.3 during typical market conditions. Readings inside this band suggest a balanced options market with no strong directional conviction. Whenever ICICIBANK PCR stays in this zone, the options market is in equilibrium — neither bulls nor bears dominate. Range-bound strategies like iron condors and strangles work well in this environment because the lack of extreme positioning reduces breakout risk.
What is considered an extreme PCR on ICICIBANK?
An extreme bullish reading appears when ICICIBANK PCR moves above 1.3-1.5. This signals that put writers are extremely confident — possibly too confident. Extreme bearish readings are below 0.6-0.7 and signal that call writers have aggressively capped upside, sometimes beyond what the fundamentals justify. As a NIFTY and BANKNIFTY and FINNIFTY constituent, ICICI Bank Ltd extreme PCR readings have historically preceded short-term reversals more often than trend continuation.
How to read ICICIBANK PCR as a contrarian signal
The contrarian approach treats extreme PCR readings as warning signs, not confirmation. When ICICIBANK PCR touches 1.5, retail traders often interpret it as a strong bullish signal. But history shows that such extreme confidence among put writers usually resolves with a pullback. Similarly, a PCR of 0.5 often marks the bottom of a decline. Contrarian traders use these extremes to fade the crowd — buying puts when PCR is too high, buying calls when it is too low.
When contrarian signals fail on ICICIBANK
Contrarian PCR signals fail when a strong trend is in place. If ICICI Bank Ltd is in a sustained rally driven by macro factors, PCR can stay above 1.3 for weeks without a meaningful correction. The market can remain irrational longer than you can stay solvent. As of 6 October 2026, always combine PCR extremes with price action confirmation — wait for the first reversal candle before acting on a contrarian PCR signal. This discipline prevents you from standing in front of a moving train.
ICICI Bank Ltd (ICICIBANK) PCR: Historical Mode for Backtesting
Why use historical ICICIBANK PCR data?
Historical mode lets you replay ICICI Bank Ltd PCR exactly as it appeared on any past trading day. This is valuable for two reasons. First, you can study past ICICIBANK moves and see whether PCR gave advance warning — building pattern recognition. Second, you can backtest your PCR-based trading rules against real data without risking capital. Traders who spend time in historical mode typically develop much better instincts than those who only look at live data.
Study routine: one ICICIBANK move per week
Each weekend, pick one significant ICICIBANK move from the past week — a rally, a selloff, or a gap. Open historical mode for the 5 sessions leading up to the move and 2 sessions after. Answer: what was PCR doing before the move? Did it give early warning? Did it signal the reversal afterward? Document your observations. After 3 months of weekly study (12 moves), you have a concrete understanding of how ICICI Bank Ltd PCR behaves around significant events.
Comparing ICICIBANK PCR across similar setups
Another useful exercise is comparing ICICIBANK PCR across similar market setups. For example, compare PCR on expiry day for 3-4 recent expiries. Is the pattern similar? Does PCR usually peak at the open and decline through the day? Does it tend to spike in the final hour? These repeating patterns become your trading playbook. As a NIFTY and BANKNIFTY and FINNIFTY constituent, ICICI Bank Ltd has enough historical data for meaningful pattern analysis across different market regimes.
Common misconceptions revealed by history
Historical study often reveals that ICICIBANK PCR does not behave the way beginners expect. A high PCR does not always mean a correction is coming. A low PCR does not always mean a bounce. The relationship depends heavily on context — trend strength, volatility regime, and event calendar. As of 6 October 2026, using historical data to build context-specific rules is far more effective than applying generic PCR thresholds blindly.
ICICI Bank Ltd (ICICIBANK) PCR: Frequently Asked Questions
What is a good PCR for ICICIBANK?
"Good" depends on what you mean. A ICICI Bank Ltd PCR near 1.0 indicates balanced sentiment — no strong directional conviction. A PCR between 1.0 and 1.2 is mildly bullish. Between 0.8 and 1.0 is mildly bearish. Above 1.3 or below 0.7 signals extreme positioning. There is no single "good" value — what matters is how PCR is moving and what context surrounds it.
How often should I check ICICIBANK PCR?
For positional traders, once a day at end-of-day is sufficient. For day traders, three checkpoints work well: opening (9:15-9:30 AM), mid-day (12:00-12:30 PM), and final hour (2:30-3:30 PM). For active scalpers, monitoring the PCR chart continuously during the session captures every shift. The right frequency depends on your trading timeframe.
Why does ICICIBANK PCR change during the day?
ICICI Bank Ltd PCR changes because fresh options contracts are created and closed throughout the session. Each new put contract increases put OI, and each closed put contract decreases it. The same applies to calls. Because the ratio depends on both sides, it moves as positioning evolves. Rapid changes often signal institutional activity, while slow changes reflect normal intraday flow.
Can I rely on ICICIBANK PCR alone for trading?
No. PCR is a valuable signal but not sufficient on its own. It works best combined with price action, trend analysis, and at least one other indicator. Most successful traders use PCR as a filter — if PCR contradicts their other signals, they reduce size or skip the trade. If PCR confirms, they trade with normal or larger size. As of 6 October 2026, this filter-based approach maximises PCR's value without over-relying on it for ICICI Bank Ltd decisions.
Put Call Ratio: Video Walkthrough
ICICIBANK PCR levels: quick reference
| PCR range | Positioning | Common reading |
|---|---|---|
| Below 0.5 | Extreme call dominance | Capitulation-level bearishness; contrarian bounce risk |
| 0.5 to 0.8 | Call writers in control | Bearish-to-cautious sentiment on ICICIBANK |
| 0.8 to 1.2 | Balanced positioning | Neutral zone; no strong directional signal |
| 1.2 to 1.5 | Put writers in control | Bullish sentiment; lower strikes being defended |
| Above 1.5 | Extreme put dominance | Overheated bullishness; contrarian pullback risk |
These bands are statistical tendencies from NSE expiry data, not fixed rules. At extremes PCR works best as a contrarian signal. The live ICICIBANK chart above recalculates PCR every minute during market hours, so you can see in real time which band the market is trading in.
How to use the StockMojo Put Call Ratio tool
- Select an underlying — Choose Nifty, BankNifty, FinNifty, or an F&O stock from the symbol selector.
- Choose live or historical view — Use the live view for intraday signals; switch to historical to compare today's PCR with prior weeks and expiries.
- Read the current PCR-OI value — Compare the live PCR against the typical neutral band (0.85-1.10 for Nifty). Note whether you're inside, above, or below the band.
- Look at the trend — A rising PCR means put positioning is building. A falling one means calls are taking over. The trend matters more than the absolute number.
- Confirm with Max Pain and OI Buildup — Cross-check the PCR signal against the Max Pain target level and the Open Interest buildup classification before acting on a trade.
ICICIBANK Put Call Ratio — Frequently Asked Questions
What is ICICIBANK PCR today?
ICICIBANK PCR (Put Call Ratio) measures the ratio of put open interest to call open interest. A reading above 1 means more puts are open (bearish on the surface) and below 1 means calls dominate (bullish on the surface). Keep in mind that PCR works best as a contrarian indicator.
What is a good PCR for ICICIBANK?
For ICICIBANK, PCR between 0.8 and 1.2 is considered neutral. PCR above 1.3-1.5 is extremely bullish, though contrarians treat it as a sign of too many puts. PCR below 0.7 is bearish, with too many calls in the system. Extreme readings often precede reversals.
How to trade ICICIBANK using PCR?
Use ICICIBANK PCR as a contrarian indicator. A very high reading points to crowded put positioning that often resolves with a move up. A very low one warns of complacency on the call side and rising pullback risk. Confirm with price action before acting on either.
How often does ICICIBANK PCR update?
During NSE market hours (9:15 AM to 3:40 PM IST) the ICICIBANK PCR chart refreshes every minute from live option chain open interest. Outside market hours the chart shows the last traded session, and historical mode lets you replay ICICIBANK PCR for any past expiry.
What is the difference between OI-based and volume-based PCR for ICICIBANK?
OI-based PCR divides total put open interest by total call open interest and reflects outstanding positions, which makes it the preferred sentiment gauge for ICICIBANK. Volume-based PCR uses the day's traded contracts instead, so it reacts faster intraday but runs noisier. StockMojo's ICICIBANK PCR chart is OI-based, with change-in-OI and total-OI views.