SBIN Put Call Ratio (PCR) Chart | Live NSE Sentiment
Put Call Ratio (PCR) for SBIN is a core sentiment indicator built from the live option chain. It divides total put open interest by total call open interest. Higher values mean more puts are being written relative to calls, which Indian F&O traders read as bullish positioning by institutions who are defending lower strikes. Lower PCR readings mean calls are accumulating faster, typically a cautious or bearish stance on SBIN.
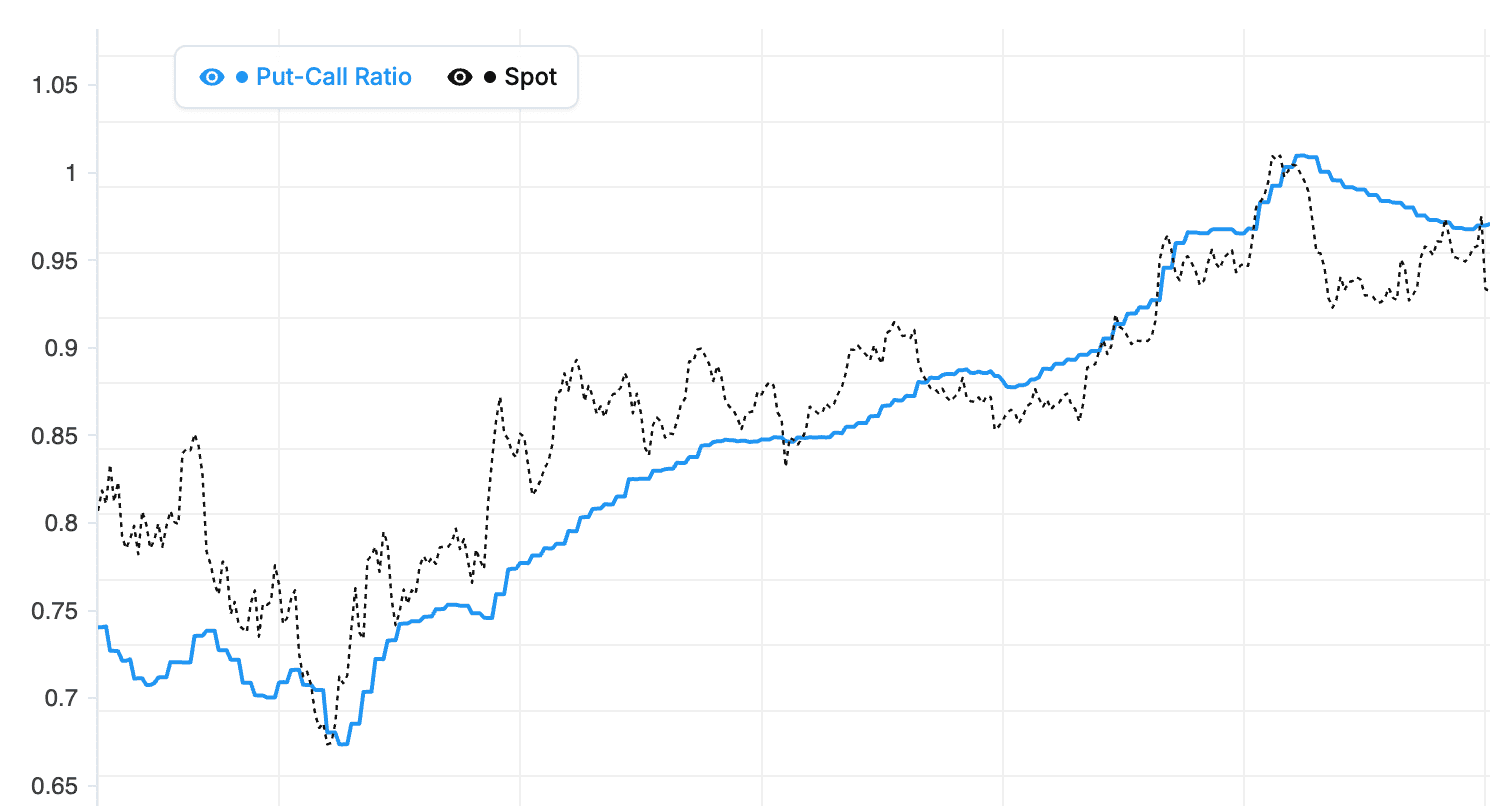
Our tool tracks SBIN PCR every minute across all active expiries on NSE. You can view PCR as a time-series chart to see how sentiment is evolving through the session, compare weekly vs monthly expiry PCR (they often diverge around event risk), and overlay the underlying price to see where PCR leads or lags the market. Historical mode lets you replay PCR on any past SBIN expiry to study how it behaved around results, RBI announcements, or major global events.
Reading SBIN PCR levels
As a general guide on SBIN: PCR below 0.7 signals heavy call writing and bearish tilt, 0.7 to 1.0 is a neutral-to-mildly-bearish zone, 1.0 to 1.3 is neutral-to-bullish, and above 1.3 signals strong put writing and bullish institutional positioning. But PCR turns contrarian at extremes. A PCR above 1.8 on SBIN often marks exhaustion bullishness that leads to sharp reversals, and a PCR below 0.5 often marks capitulation bearishness that gets bought.
Use PCR alongside our Max Pain Calculator, Call vs Put OI Chart, and Open Interest Analysis to build a complete view ofSBIN option-market positioning each trading session.
State Bank of India (SBIN) Put Call Ratio: What the Number Means
What is the SBIN Put Call Ratio?
The Put Call Ratio (PCR) for State Bank of India (SBIN) is a simple but powerful number. It is calculated by dividing the total put open interest by the total call open interest across all SBIN strikes for a given expiry. If put OI is 20 lakh and call OI is 25 lakh, the PCR is 0.8. Because option writers (sellers) tend to be more informed than retail buyers, the direction in which PCR moves often reveals how the smart money is positioned on SBIN. As a NIFTY and BANKNIFTY and FINNIFTY constituent, PCR is one of the most watched sentiment numbers in the Indian options market.
What does a SBIN PCR above 1 mean?
When the SBIN PCR is above 1, more put contracts are outstanding than call contracts. In standard interpretation this sounds bearish — the market has bought more puts than calls. But the contrarian reading is often more accurate: a high PCR means put writers (who collect premium) are confident that SBIN will stay above the put strikes. So a rising PCR on State Bank of India is frequently bullish for short-term direction, especially when it climbs above 1.0 from a lower level.
What does a SBIN PCR below 1 mean?
A PCR below 1 means call OI is larger than put OI for SBIN. The standard reading is that traders expect the price to rise (more calls bought). The contrarian reading says call writers are confident that SBIN will stay below the call strikes — a bearish ceiling is forming. In practice, when PCR for State Bank of India drops below 0.8 from a higher level, it often signals short-term weakness or at least capped upside.
Using the SBIN PCR for today's decisions
As of 6 October 2026, start with a simple rule. Check the SBIN PCR at the start of the session. If it is near 1.0, sentiment is balanced and State Bank of India is likely to trade in a range. If it is trending higher through the day, the bullish lean is strengthening. If it is trending lower, bears are gaining control. Combine the direction and level — a value of 1.1 that is rising is different from a value of 1.1 that is falling. The PCR chart in the tool plots this full intraday journey.
State Bank of India (SBIN) PCR Combined with Price Action
Why PCR alone is not enough for SBIN
PCR is a sentiment number, not a price predictor. The same PCR value can have completely different meanings depending on what SBIN price is doing. A PCR of 1.2 while State Bank of India is grinding higher is very different from a PCR of 1.2 while SBIN is crashing. Context is everything. Always read PCR alongside the SBIN price chart to confirm whether the sentiment aligns with the trend or contradicts it.
Bullish alignment on SBIN
The strongest bullish setup on State Bank of India is when PCR is rising AND price is rising. Put writers are confident, and the market is validating that confidence with actual upside. This alignment signals that the rally has conviction behind it — it is not just short covering or thin-volume drift. Enter long positions in this environment. Target the next major resistance level or the highest call OI strike. Stop loss goes below the recent swing low.
Bearish alignment on SBIN
The strongest bearish setup is when SBIN PCR is falling AND price is falling. Call writers are aggressive, and price is respecting their ceiling. The selloff is backed by real positioning, not just profit-taking. Enter short positions with the State Bank of India trend, target the next major support, and keep stops above the recent swing high. The combined signal is much more reliable than either PCR or price action alone.
Divergence between SBIN PCR and price
When PCR and price disagree, a reversal is often brewing. Price rising + PCR falling means the rally lacks put-writer conviction — it may fail soon. Price falling + PCR rising means the decline lacks call-writer conviction — a bounce may be near. These divergences are some of the most valuable PCR signals because they alert you to potential turning points before they become obvious in price. As of 6 October 2026, divergence trades require patience but offer excellent risk-reward when they work.
State Bank of India (SBIN) PCR: Event-Driven Shifts
How do events affect SBIN PCR?
Before major events like quarterly earnings, board meetings, and sector regulatory changes, State Bank of India PCR often behaves differently from normal trading days. Hedging activity increases, which can push PCR in one direction or the other depending on how institutions are preparing. Event-driven PCR moves often do not reflect genuine directional sentiment — they reflect protective positioning.
Pre-event SBIN PCR distortions
A few days before a major event, SBIN PCR may spike to unusual levels as traders hedge. A PCR of 1.5 driven by pre-event put buying does not necessarily mean sentiment is bullish — it means traders are buying protection. This is different from a PCR of 1.5 driven by put writing (which would be genuinely bullish). To distinguish, check whether the put OI change is from buying (bearish hedging) or selling (bullish positioning). Context matters.
Post-event SBIN PCR reset
After the event is over (typically within 1-2 sessions), State Bank of India PCR usually normalizes. Hedging positions are unwound, and PCR reflects the new post-event sentiment. Watch carefully for the direction of this normalization. If PCR drops back to normal quickly, the event had less impact than expected. If it stays elevated, the event has created lasting concerns.
Trading SBIN around events with PCR
Around major events, PCR signals are less reliable. Most traders avoid taking large directional positions in the 1-2 days before and after events. The uncertainty is too high and the signal-to-noise ratio drops. Instead, use non-directional strategies like iron condors to profit from the post-event IV crush. Resume normal PCR-based trading once the event has passed and positioning normalizes. As of 6 October 2026, respecting this event-driven pause protects capital during the most unpredictable periods.
Put Call Ratio: Video Walkthrough
SBIN PCR levels: quick reference
| PCR range | Positioning | Common reading |
|---|---|---|
| Below 0.5 | Extreme call dominance | Capitulation-level bearishness; contrarian bounce risk |
| 0.5 to 0.8 | Call writers in control | Bearish-to-cautious sentiment on SBIN |
| 0.8 to 1.2 | Balanced positioning | Neutral zone; no strong directional signal |
| 1.2 to 1.5 | Put writers in control | Bullish sentiment; lower strikes being defended |
| Above 1.5 | Extreme put dominance | Overheated bullishness; contrarian pullback risk |
These bands are statistical tendencies from NSE expiry data, not fixed rules. At extremes PCR works best as a contrarian signal. The live SBIN chart above recalculates PCR every minute during market hours, so you can see in real time which band the market is trading in.
How to use the StockMojo Put Call Ratio tool
- Select an underlying — Choose Nifty, BankNifty, FinNifty, or an F&O stock from the symbol selector.
- Choose live or historical view — Use the live view for intraday signals; switch to historical to compare today's PCR with prior weeks and expiries.
- Read the current PCR-OI value — Compare the live PCR against the typical neutral band (0.85-1.10 for Nifty). Note whether you're inside, above, or below the band.
- Look at the trend — A rising PCR means put positioning is building. A falling one means calls are taking over. The trend matters more than the absolute number.
- Confirm with Max Pain and OI Buildup — Cross-check the PCR signal against the Max Pain target level and the Open Interest buildup classification before acting on a trade.
SBIN Put Call Ratio — Frequently Asked Questions
What is SBIN PCR today?
SBIN PCR (Put Call Ratio) measures the ratio of put open interest to call open interest. A reading above 1 means more puts are open (bearish on the surface) and below 1 means calls dominate (bullish on the surface). Keep in mind that PCR works best as a contrarian indicator.
What is a good PCR for SBIN?
For SBIN, PCR between 0.8 and 1.2 is considered neutral. PCR above 1.3-1.5 is extremely bullish, though contrarians treat it as a sign of too many puts. PCR below 0.7 is bearish, with too many calls in the system. Extreme readings often precede reversals.
How to trade SBIN using PCR?
Use SBIN PCR as a contrarian indicator. A very high reading points to crowded put positioning that often resolves with a move up. A very low one warns of complacency on the call side and rising pullback risk. Confirm with price action before acting on either.
How often does SBIN PCR update?
During NSE market hours (9:15 AM to 3:40 PM IST) the SBIN PCR chart refreshes every minute from live option chain open interest. Outside market hours the chart shows the last traded session, and historical mode lets you replay SBIN PCR for any past expiry.
What is the difference between OI-based and volume-based PCR for SBIN?
OI-based PCR divides total put open interest by total call open interest and reflects outstanding positions, which makes it the preferred sentiment gauge for SBIN. Volume-based PCR uses the day's traded contracts instead, so it reacts faster intraday but runs noisier. StockMojo's SBIN PCR chart is OI-based, with change-in-OI and total-OI views.