RELIANCE Put Call Ratio (PCR) Chart | Live NSE Sentiment
Put Call Ratio (PCR) for RELIANCE is a core sentiment indicator built from the live option chain. It divides total put open interest by total call open interest. Higher values mean more puts are being written relative to calls, which Indian F&O traders read as bullish positioning by institutions who are defending lower strikes. Lower PCR readings mean calls are accumulating faster, typically a cautious or bearish stance on RELIANCE.
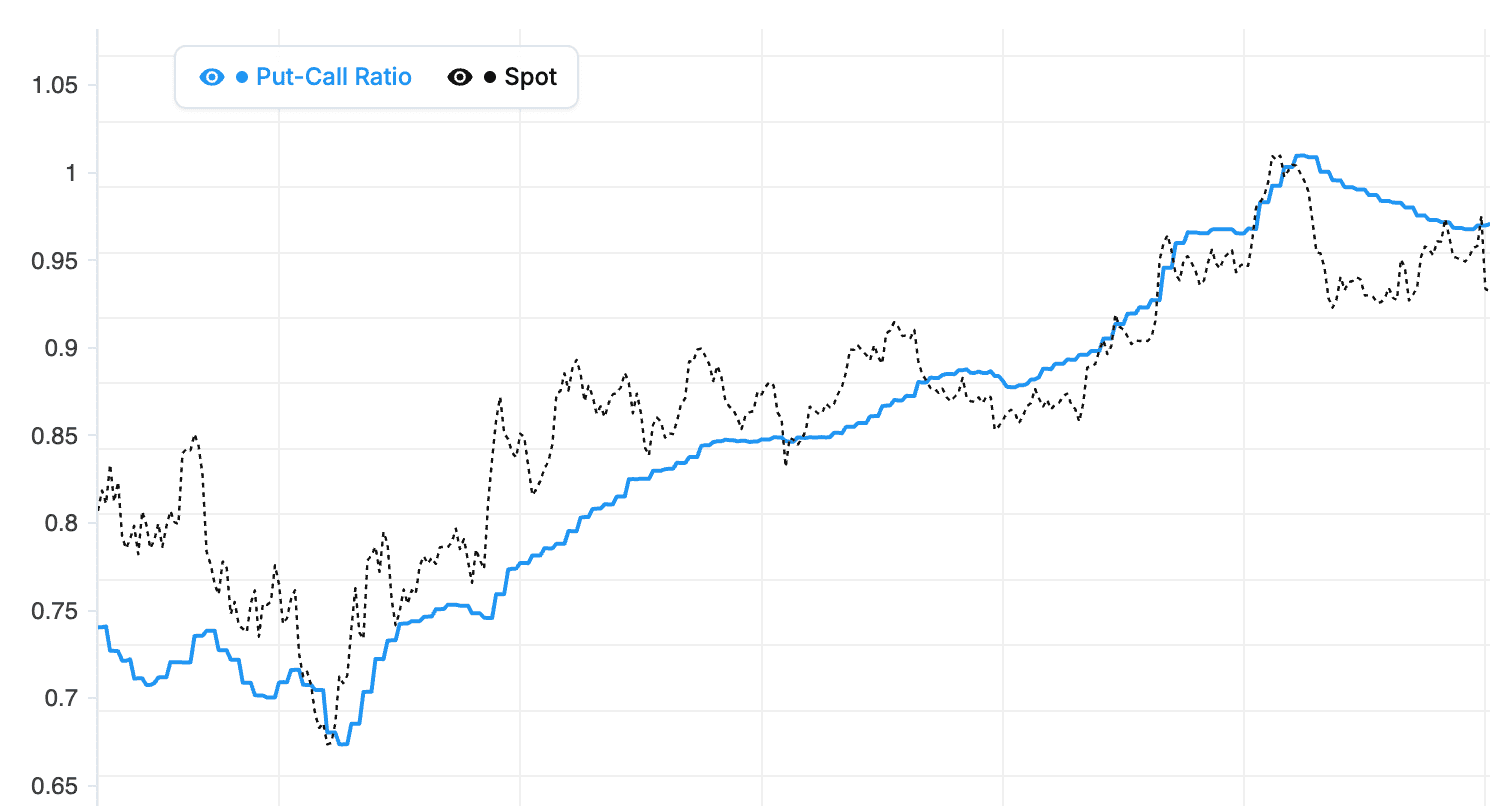
Our tool tracks RELIANCE PCR every minute across all active expiries on NSE. You can view PCR as a time-series chart to see how sentiment is evolving through the session, compare weekly vs monthly expiry PCR (they often diverge around event risk), and overlay the underlying price to see where PCR leads or lags the market. Historical mode lets you replay PCR on any past RELIANCE expiry to study how it behaved around results, RBI announcements, or major global events.
Reading RELIANCE PCR levels
As a general guide on RELIANCE: PCR below 0.7 signals heavy call writing and bearish tilt, 0.7 to 1.0 is a neutral-to-mildly-bearish zone, 1.0 to 1.3 is neutral-to-bullish, and above 1.3 signals strong put writing and bullish institutional positioning. But PCR turns contrarian at extremes. A PCR above 1.8 on RELIANCE often marks exhaustion bullishness that leads to sharp reversals, and a PCR below 0.5 often marks capitulation bearishness that gets bought.
Use PCR alongside our Max Pain Calculator, Call vs Put OI Chart, and Open Interest Analysis to build a complete view ofRELIANCE option-market positioning each trading session.
Reliance Industries Ltd (RELIANCE) PCR: Advanced Tips for Power Users
Tip 1: track RELIANCE PCR rate of change
Advanced users do not just watch the PCR value — they watch the rate at which it is changing. A PCR moving from 1.0 to 1.1 slowly over the day is routine. A PCR moving from 1.0 to 1.2 in just 15 minutes is a significant event. Rapid changes often indicate institutional orders hitting the market. Set a mental threshold — any change above 0.1 in a 30-minute window on Reliance Industries Ltd warrants investigation.
Tip 2: compare RELIANCE PCR to related symbols
Look at Reliance Industries Ltd PCR alongside the PCR of related symbols. For Reliance Industries Ltd, compare against the PCR of NIFTY to see if sector-level and index-level sentiment agree. Broader alignment strengthens the signal; divergence suggests the move is specific to RELIANCE.
Tip 3: watch for RELIANCE PCR "reset" patterns
PCR rarely moves in a straight line. After a sustained trend, it usually "resets" — a sharp move in the opposite direction followed by resumption of the trend. If you see Reliance Industries Ltd PCR suddenly reverse after a strong multi-day trend, do not immediately assume the trend is over. Wait 2-3 sessions to see whether the reset leads to a new trend or the old trend resumes. Many false reversal trades come from reacting too quickly to a normal reset.
Tip 4: integrate RELIANCE PCR into a simple daily checklist
Build a 5-point daily checklist: 1) Yesterday's RELIANCE closing PCR. 2) Today's opening PCR. 3) Direction during the first hour. 4) Current PCR and trend. 5) Alignment or divergence with price action. Fill out this checklist at the end of each session and save it. Over time, you build a personal playbook that combines PCR with your specific trading style. As of 6 October 2026, this level of discipline is what separates traders who use PCR effectively from those who just glance at the number. As a NIFTY constituent, Reliance Industries Ltd rewards this kind of consistent, structured analysis.
Reliance Industries Ltd (RELIANCE) PCR Across Multiple Expiries
Why compare RELIANCE PCR across different expiries?
Each RELIANCE expiry has its own PCR. The current week's PCR reflects very short-term positioning. The current month's PCR reflects medium-term sentiment. Comparing them tells you whether traders agree or disagree across timeframes. If current-week PCR is 0.9 (mildly bearish) but current-month PCR is 1.3 (bullish), Reliance Industries Ltd is facing short-term resistance but medium-term support. This cross-expiry divergence is one of the more sophisticated PCR reads.
Reading RELIANCE weekly vs monthly PCR
Weekly PCR moves faster and is noisier. It reflects the week's specific events and positioning. Monthly PCR is slower and more structural. It reflects how institutions are positioned for the entire month. When making short-term trading decisions (1-3 days), weekly PCR is more relevant. When making positional decisions (1-3 weeks), monthly PCR matters more. As a NIFTY constituent, Reliance Industries Ltd typically has active OI at both weekly and monthly expiries.
Spotting rollover patterns in RELIANCE PCR
In the days leading up to an expiry, traders roll positions to the next expiry. The PCR of the current expiry drops as positions unwind. The PCR of the next expiry builds up as new positions are created. By watching how PCR shifts across expiries during the rollover window, you see whether traders are maintaining their bias, increasing it, or reversing it. If current-month PCR was 1.2 and next-month PCR is forming at 1.4, the bullish lean is strengthening. At 1.0, it is weakening.
Using multi-expiry RELIANCE PCR for positioning
A practical routine: check both current expiry and next expiry PCR at the start of each trading week. Note any divergences. If both are aligned (both high or both low), expect the bias to persist. If they diverge, the weaker timeframe usually converges toward the stronger one over the next 1-2 weeks. As of 6 October 2026, this multi-expiry comparison takes 2 minutes and provides a much clearer picture than looking at just the current expiry PCR.
Reliance Industries Ltd (RELIANCE) PCR: Intraday Trading Playbook
Pre-market RELIANCE PCR check
Before the market opens, check the previous session's closing PCR for Reliance Industries Ltd. This is your baseline. If yesterday closed at 1.1 (mildly bullish), start today expecting bullish-leaning positioning. If it closed at 0.85 (mildly bearish), expect bearish-leaning. The previous close sets the context; today's changes tell you whether that context is holding or shifting.
Opening hour RELIANCE PCR reading
In the first 30-60 minutes of trading (9:15-10:00 AM), watch how RELIANCE PCR moves relative to the previous close. A sharp move in either direction during this window reflects overnight institutional orders hitting the market. Rising PCR in the opening hour is bullish for the session. Falling PCR is bearish. This opening-hour read is often the best guide for intraday bias.
Mid-day RELIANCE PCR reassessment
Between 11:00 AM and 1:30 PM, Reliance Industries Ltd PCR activity slows down. Use this quieter window to check whether the morning's trend is holding. If PCR is still rising, bullish momentum is persisting. If it has stalled or reversed, the morning bias may not hold into the afternoon. Adjust your active positions accordingly.
Final-hour RELIANCE PCR for next-day positioning
The last hour (2:30-3:30 PM) is when institutional traders make their end-of-day positioning adjustments. Rapid PCR moves in this window are highly predictive for the next session. A strong rise in the final hour often means overnight positioning is bullish — expect a firm open next day. A strong fall suggests bearish carry-over. As of 6 October 2026, the closing PCR trend is one of the most valuable inputs for overnight trading decisions on Reliance Industries Ltd.
Put Call Ratio: Video Walkthrough
RELIANCE PCR levels: quick reference
| PCR range | Positioning | Common reading |
|---|---|---|
| Below 0.5 | Extreme call dominance | Capitulation-level bearishness; contrarian bounce risk |
| 0.5 to 0.8 | Call writers in control | Bearish-to-cautious sentiment on RELIANCE |
| 0.8 to 1.2 | Balanced positioning | Neutral zone; no strong directional signal |
| 1.2 to 1.5 | Put writers in control | Bullish sentiment; lower strikes being defended |
| Above 1.5 | Extreme put dominance | Overheated bullishness; contrarian pullback risk |
These bands are statistical tendencies from NSE expiry data, not fixed rules. At extremes PCR works best as a contrarian signal. The live RELIANCE chart above recalculates PCR every minute during market hours, so you can see in real time which band the market is trading in.
How to use the StockMojo Put Call Ratio tool
- Select an underlying — Choose Nifty, BankNifty, FinNifty, or an F&O stock from the symbol selector.
- Choose live or historical view — Use the live view for intraday signals; switch to historical to compare today's PCR with prior weeks and expiries.
- Read the current PCR-OI value — Compare the live PCR against the typical neutral band (0.85-1.10 for Nifty). Note whether you're inside, above, or below the band.
- Look at the trend — A rising PCR means put positioning is building. A falling one means calls are taking over. The trend matters more than the absolute number.
- Confirm with Max Pain and OI Buildup — Cross-check the PCR signal against the Max Pain target level and the Open Interest buildup classification before acting on a trade.
RELIANCE Put Call Ratio — Frequently Asked Questions
What is RELIANCE PCR today?
RELIANCE PCR (Put Call Ratio) measures the ratio of put open interest to call open interest. A reading above 1 means more puts are open (bearish on the surface) and below 1 means calls dominate (bullish on the surface). Keep in mind that PCR works best as a contrarian indicator.
What is a good PCR for RELIANCE?
For RELIANCE, PCR between 0.8 and 1.2 is considered neutral. PCR above 1.3-1.5 is extremely bullish, though contrarians treat it as a sign of too many puts. PCR below 0.7 is bearish, with too many calls in the system. Extreme readings often precede reversals.
How to trade RELIANCE using PCR?
Use RELIANCE PCR as a contrarian indicator. A very high reading points to crowded put positioning that often resolves with a move up. A very low one warns of complacency on the call side and rising pullback risk. Confirm with price action before acting on either.
How often does RELIANCE PCR update?
During NSE market hours (9:15 AM to 3:40 PM IST) the RELIANCE PCR chart refreshes every minute from live option chain open interest. Outside market hours the chart shows the last traded session, and historical mode lets you replay RELIANCE PCR for any past expiry.
What is the difference between OI-based and volume-based PCR for RELIANCE?
OI-based PCR divides total put open interest by total call open interest and reflects outstanding positions, which makes it the preferred sentiment gauge for RELIANCE. Volume-based PCR uses the day's traded contracts instead, so it reacts faster intraday but runs noisier. StockMojo's RELIANCE PCR chart is OI-based, with change-in-OI and total-OI views.