INFY Multi-Straddle Chart | Live Multi-Straddle Premium
The multi-straddle chart for INFY lets you overlay the combined CE + PE premium of several strikes on a single chart, so you can see how each strike's straddle is repricing through the session. Instead of switching between individual straddle charts, you get a unified view of INFY's straddle structure in one place.
This is particularly powerful for INFY volatility traders. Watch how ATM, near-ATM, and OTM straddles are repricing in real time to read the skew. If OTM is richening faster than ATM, the market is pricing tail risk — useful information before events. If far-OTM is collapsing while ATM holds, mean reversion is underway. Combined mode lets you treat several straddles as a single basket premium — useful for strangle baskets or far-wing exposure.
Using INFY multi-straddle data for strategy construction
Before entering a short-volatility position on INFY, overlay the candidate straddles and study how they have moved together over the session. Two straddles that should move in tandem but diverged often signal a pricing anomaly worth trading. Live mode streams every selected INFY straddle in real time.
Complement the multi-straddle chart with our ATM Straddle, Multi-Strike Chart, Premium Decay, and Live Option Chain tools for richer INFY option-market analysis on NSE.
Infosys Ltd (INFY) Multi-Straddle Chart: What It Shows
What is the INFY multi-straddle chart?
The multi-straddle chart for Infosys Ltd (INFY) overlays the combined CE + PE premium of several strikes on a single time series. Each line is one strike's straddle. Instead of tracking calls and puts separately, you watch the direction-neutral premium for each strike, which strips out direction and focuses purely on volatility, gamma, and time decay. As a NIFTY constituent, Infosys Ltd straddles trade with enough depth to make this overlay practical through every session.
Why look at straddles instead of legs?
A single call or put can move because of direction, IV, or theta. A straddle (call + put at the same strike) cancels most of the directional component. What's left is volatility and time. Plotting multiple straddles together turns INFY into a clean volatility-comparison chart — you see how each strike's IV is being priced relative to the others.
Which straddles should I overlay on INFY?
Start with the ATM straddle plus 2-3 OTM straddles on each side (puts and calls). Five is the practical sweet spot. Too few hides skew patterns; too many crowds the chart. As of 21 September 2026, traders watching Infosys Ltd often build a fixed set of strikes they study every session, which builds intuition over weeks.
Reading the INFY multi-straddle chart today
Open the tool, pick your strikes, and watch the spacing and slope of the straddle lines. Wide spacing means strikes are pricing different volatility levels (skew is present). Narrow spacing means uniform volatility. Slopes downward together signal calm theta decay; jumpy lines signal an active volatility regime.
Infosys Ltd (INFY) Multi-Straddle Chart: Strangle Selection
Picking strangle legs on INFY
A strangle is two OTM legs — a call and a put at different strikes. The multi-straddle chart helps you compare candidate strangle pairs. For each potential pair, look at the OTM-call straddle and OTM-put straddle lines. Compare their decay rates and IV levels. The pair where both lines are elevated relative to their typical range gives the richest entry.
Width vs richness trade-off
Wider strangles (further-OTM strikes) collect less premium but have lower hit risk. Narrower strangles collect more but are at higher hit risk. The multi-straddle chart lets you visualise current premiums at multiple widths simultaneously — pick the width where the premium is unusually elevated relative to recent history on Infosys Ltd.
Adjusting strangles intraday
If one side's straddle starts rising sharply, that's the breakout side. The multi-straddle chart shows it before the option chain reflects it cleanly. Adjusting the threatened leg early — rolling or hedging — preserves more of the position's value than waiting.
Strangles as of 21 September 2026
For INFY, strangles work best in mean-reverting environments. Use the multi-straddle chart to confirm the regime before entry. Avoid strangles when chart shows steepening skew or expanding spacing — both signal active directional risk.
Infosys Ltd (INFY) Multi-Straddle Chart: Combining With OI Data
Premium vs open interest on INFY
The multi-straddle chart shows premium. The option-chain or multi-strike OI tools show open interest. Premium tells you what the market is paying right now. OI tells you how much capital is committed at each strike. Both together give the most complete read on Infosys Ltd positioning.
Confluence: premium + OI agree
If the ATM straddle on the multi-straddle chart is rising AND ATM OI is rising on the OI tool, fresh positioning with conviction is building. This is a much stronger signal than either alone. Trade ideas built on confluence outperform single-signal ideas on INFY.
Divergence: premium and OI disagree
Premium rising while OI stays flat means existing positions are being re-priced — no new commitment. Premium flat while OI rises means fresh positions are building at current prices — quiet accumulation. Both are informative, but they require careful interpretation.
Combining views as of 21 September 2026
Keep both tools open. Glance at the OI distribution to know where capital is concentrated, then watch the multi-straddle chart for how that capital is being repriced through the session. This pair gives Infosys Ltd traders an institutional-quality view at retail tools.
INFY multi-straddle patterns: quick reference
| Cross-strike pattern | Volatility read | Common interpretation |
|---|---|---|
| All straddles rising together | Volatility expansion | Market pricing a bigger INFY move; long-volatility setups favoured |
| All straddles falling together | Volatility compression | Theta decay dominating; range-bound session, premium sellers in control |
| OTM rising faster than ATM | Skew steepening | Tail risk being priced — common before RBI policy, Budget, or results |
| OTM falling while ATM holds | Skew flattening | Event premium unwinding; volatility mean-reverting |
| Two normally-tracking straddles diverging | Pricing anomaly | Relative-value opportunity; check strike liquidity before trading it |
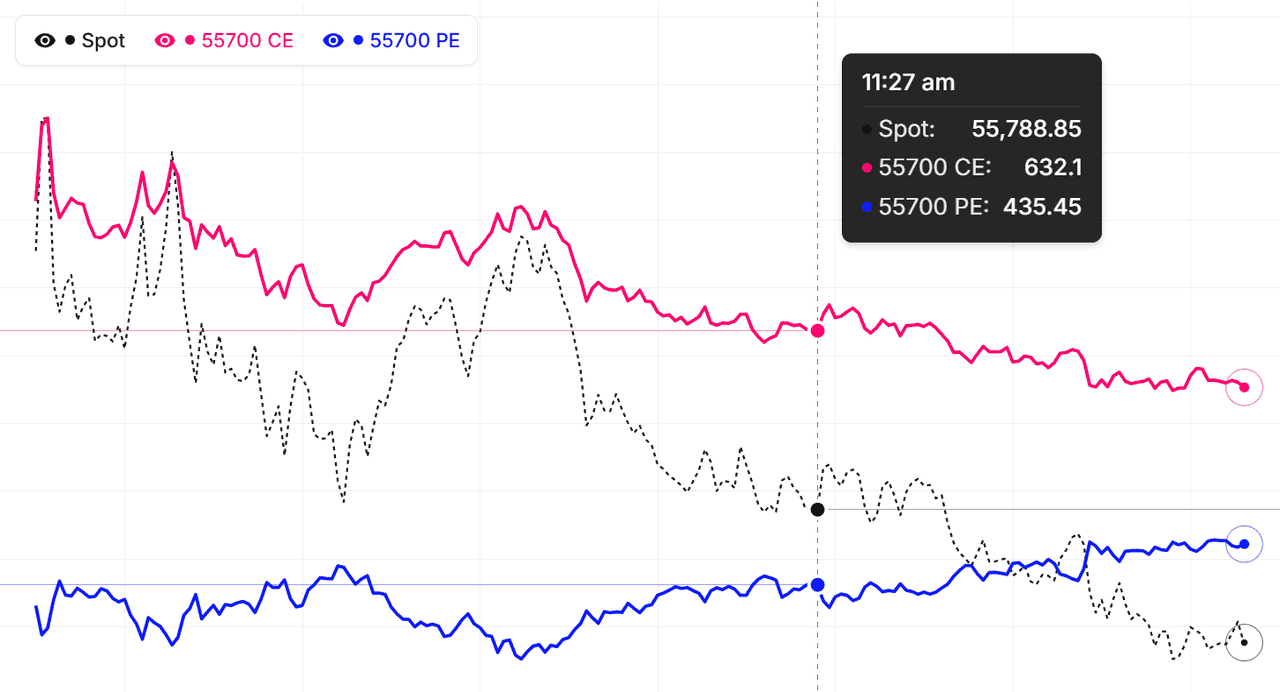
Read these regimes from the relative slopes of the straddle lines, not absolute premium levels — every symbol trades at a different premium scale. The live INFY chart above replots every selected straddle each minute during market hours, so an expansion, compression, or skew shift shows up within minutes of the market repricing it.
How to use the Multi-Straddle Chart
- Pick the underlying and expiry — Choose Nifty, BankNifty, or any F&O stock. Pick the expiry whose straddles you want to compare.
- Add straddles — Click strikes from the available list. Each click adds one straddle (both CE and PE at that strike). Up to 5 straddles can plot together.
- Choose Individual or Combined — Individual: each straddle as its own line. Combined: sum of all selected straddles, with a Line/Candle toggle.
- Pick Simple or Drawing chart — Simple for quick analysis. Drawing adds trendlines, fib, and full TradingView toolkit.
- Live or Historical — Live for current-session monitoring. Historical for replaying past events or back-testing.
INFY Multi-Straddle Chart — Frequently Asked Questions
What is INFY Multi-Straddle Chart?
INFY Multi-Straddle Chart displays multiple option straddles (CE + PE per strike) on a single chart, allowing you to compare combined premiums across different strikes and identify volatility skew patterns for better trading decisions. Each line is direction-neutral, so what you are comparing is pure volatility and time-decay behaviour per strike.
How to use Multi-Straddle Chart for INFY?
Pick up to 5 INFY strikes — each adds a straddle (CE + PE). Use Individual mode to compare straddles side by side, or Combined mode to see them summed as a single basket premium. Switch to Drawing mode for trendlines, fib levels, and advanced annotations.
How is the INFY Multi-Straddle Chart different from a single straddle chart?
A single straddle chart tracks one strike's combined CE + PE premium, usually ATM. The INFY multi-straddle chart overlays up to 5 straddles at once, so you can compare how ATM, near-ATM, and OTM strikes reprice relative to each other. That cross-strike view exposes volatility skew and pricing anomalies a single-straddle chart cannot show.
What does it mean when INFY OTM straddles rise faster than the ATM straddle?
It signals skew steepening — the market is bidding up tail risk on INFY and paying more for movement beyond those OTM strikes, a pattern common before RBI policy, Budget, or earnings. The reverse — OTM straddles collapsing while the ATM holds — means event premium is unwinding and volatility is mean-reverting.
How often does the INFY Multi-Straddle Chart update?
During NSE market hours (9:15 AM to 3:40 PM IST) every selected INFY straddle refreshes every minute from live CE and PE prices. Outside market hours the chart shows the last traded session, and Historical mode lets you replay the full INFY straddle structure for any past trading day and expiry.