TCS Multi-Straddle Chart | Live Multi-Straddle Premium
The multi-straddle chart for TCS lets you overlay the combined CE + PE premium of several strikes on a single chart, so you can see how each strike's straddle is repricing through the session. Instead of switching between individual straddle charts, you get a unified view of TCS's straddle structure in one place.
This is particularly powerful for TCS volatility traders. Watch how ATM, near-ATM, and OTM straddles are repricing in real time to read the skew. If OTM is richening faster than ATM, the market is pricing tail risk — useful information before events. If far-OTM is collapsing while ATM holds, mean reversion is underway. Combined mode lets you treat several straddles as a single basket premium — useful for strangle baskets or far-wing exposure.
Using TCS multi-straddle data for strategy construction
Before entering a short-volatility position on TCS, overlay the candidate straddles and study how they have moved together over the session. Two straddles that should move in tandem but diverged often signal a pricing anomaly worth trading. Live mode streams every selected TCS straddle in real time.
Complement the multi-straddle chart with our ATM Straddle, Multi-Strike Chart, Premium Decay, and Live Option Chain tools for richer TCS option-market analysis on NSE.
Tata Consultancy Services Ltd (TCS) Multi-Straddle Chart: Combined Basket View
What does combined mode show on TCS?
Combined mode sums all your selected straddle premiums into one series — line or candle. This represents the total premium of your "straddle basket" at each timestamp. For Tata Consultancy Services Ltd traders running multi-strike strangles or ladders, this single number is a fast proxy for total volatility exposure.
When to use combined line
Combined line mode is best for tracking session-long premium decay across a basket. The line slopes downward as theta works on all strikes simultaneously. Sudden jumps signal that the whole IV surface is repricing — often event-related or news-driven on TCS.
When to use combined candle
Combined candle mode shows OHLC for the basket. Useful when you want to see intraday range, not just close-to-close drift. A wide-range combined candle means the basket saw real volatility within the bar; a small candle means a quiet bar. This is the cleanest read on intraday volatility on Tata Consultancy Services Ltd.
Basket sizing decisions as of 21 September 2026
Use the combined line/candle alongside individual mode. Individual tells you which strikes are leading; combined tells you the bottom-line P&L exposure. As of 21 September 2026, Tata Consultancy Services Ltd basket traders use the combined view to set stops and targets at the portfolio level, not just per-strike.
Tata Consultancy Services Ltd (TCS) Multi-Straddle Chart: Combining With Price
Why watch both TCS charts together?
The multi-straddle chart shows volatility. The price chart shows direction. Combined, they cover the two main dimensions of options trading. A breakout on the price chart is more reliable when the multi-straddle chart shows expanding spacing — fresh volatility entering — on the same side.
Confluence setups on Tata Consultancy Services Ltd
When price breaks resistance AND OTM-call straddles spike on the multi-straddle chart, both signals agree on a bullish move. Long calls or call spreads have stronger conviction. When price breaks support AND OTM-put straddles spike, both agree on bearish — long puts or put spreads.
Divergence warnings
Price moving but all straddle lines staying flat suggests the move lacks volatility conviction — it may not hold. Straddles spiking but price stuck in range suggests positioning before a breakout — pay attention to which side the spike is on for direction clues on TCS.
Combining tools as of 21 September 2026
Keep the multi-straddle chart on one screen and the price chart on another. Glance at both before every trade decision. Two-signal trades have meaningfully better win rates than single-signal trades — and the multi-straddle chart is one of the strongest second signals available on Tata Consultancy Services Ltd.
Tata Consultancy Services Ltd (TCS) Multi-Straddle Chart: Best Practices
Best practice 1: Check at consistent times on TCS
Check the multi-straddle chart at the same 2-3 moments each day — opening, mid-day, close. Consistency builds pattern recognition. You start noticing when today's chart looks different from a normal day. Random checking produces no such awareness.
Best practice 2: Always classify regime first
Before interpreting any pattern, classify the volatility regime. Low-vol vs high-vol regimes have completely different "normal" patterns. Reading without regime context leads to false alarms and missed signals on Tata Consultancy Services Ltd.
Best practice 3: Pair with at least one other signal
Never trade solely on the multi-straddle chart. Combine with price action, OI data, or technical levels. The two-signal rule filters out roughly half of unreliable setups and dramatically improves win rate.
Best practice 4: Journal observations as of 21 September 2026
Write down what you see — chart shape, unusual patterns, your interpretation, what happened next. Over weeks this log becomes your personal playbook. Generic advice is a starting point; journaled experience is what produces real skill on TCS.
TCS multi-straddle patterns: quick reference
| Cross-strike pattern | Volatility read | Common interpretation |
|---|---|---|
| All straddles rising together | Volatility expansion | Market pricing a bigger TCS move; long-volatility setups favoured |
| All straddles falling together | Volatility compression | Theta decay dominating; range-bound session, premium sellers in control |
| OTM rising faster than ATM | Skew steepening | Tail risk being priced — common before RBI policy, Budget, or results |
| OTM falling while ATM holds | Skew flattening | Event premium unwinding; volatility mean-reverting |
| Two normally-tracking straddles diverging | Pricing anomaly | Relative-value opportunity; check strike liquidity before trading it |
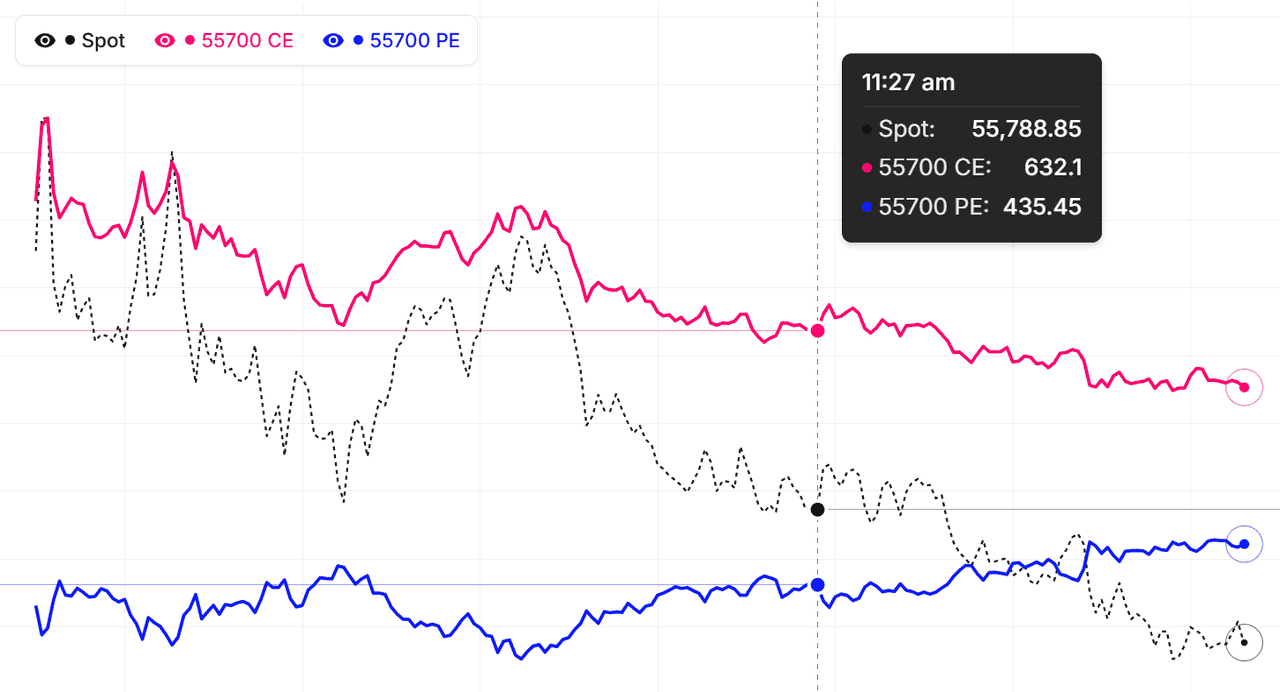
Read these regimes from the relative slopes of the straddle lines, not absolute premium levels — every symbol trades at a different premium scale. The live TCS chart above replots every selected straddle each minute during market hours, so an expansion, compression, or skew shift shows up within minutes of the market repricing it.
How to use the Multi-Straddle Chart
- Pick the underlying and expiry — Choose Nifty, BankNifty, or any F&O stock. Pick the expiry whose straddles you want to compare.
- Add straddles — Click strikes from the available list. Each click adds one straddle (both CE and PE at that strike). Up to 5 straddles can plot together.
- Choose Individual or Combined — Individual: each straddle as its own line. Combined: sum of all selected straddles, with a Line/Candle toggle.
- Pick Simple or Drawing chart — Simple for quick analysis. Drawing adds trendlines, fib, and full TradingView toolkit.
- Live or Historical — Live for current-session monitoring. Historical for replaying past events or back-testing.
TCS Multi-Straddle Chart — Frequently Asked Questions
What is TCS Multi-Straddle Chart?
TCS Multi-Straddle Chart displays multiple option straddles (CE + PE per strike) on a single chart, allowing you to compare combined premiums across different strikes and identify volatility skew patterns for better trading decisions. Each line is direction-neutral, so what you are comparing is pure volatility and time-decay behaviour per strike.
How to use Multi-Straddle Chart for TCS?
Pick up to 5 TCS strikes — each adds a straddle (CE + PE). Use Individual mode to compare straddles side by side, or Combined mode to see them summed as a single basket premium. Switch to Drawing mode for trendlines, fib levels, and advanced annotations.
How is the TCS Multi-Straddle Chart different from a single straddle chart?
A single straddle chart tracks one strike's combined CE + PE premium, usually ATM. The TCS multi-straddle chart overlays up to 5 straddles at once, so you can compare how ATM, near-ATM, and OTM strikes reprice relative to each other. That cross-strike view exposes volatility skew and pricing anomalies a single-straddle chart cannot show.
What does it mean when TCS OTM straddles rise faster than the ATM straddle?
It signals skew steepening — the market is bidding up tail risk on TCS and paying more for movement beyond those OTM strikes, a pattern common before RBI policy, Budget, or earnings. The reverse — OTM straddles collapsing while the ATM holds — means event premium is unwinding and volatility is mean-reverting.
How often does the TCS Multi-Straddle Chart update?
During NSE market hours (9:15 AM to 3:40 PM IST) every selected TCS straddle refreshes every minute from live CE and PE prices. Outside market hours the chart shows the last traded session, and Historical mode lets you replay the full TCS straddle structure for any past trading day and expiry.