TCS Price vs Open Interest | Live Buildup & Unwinding
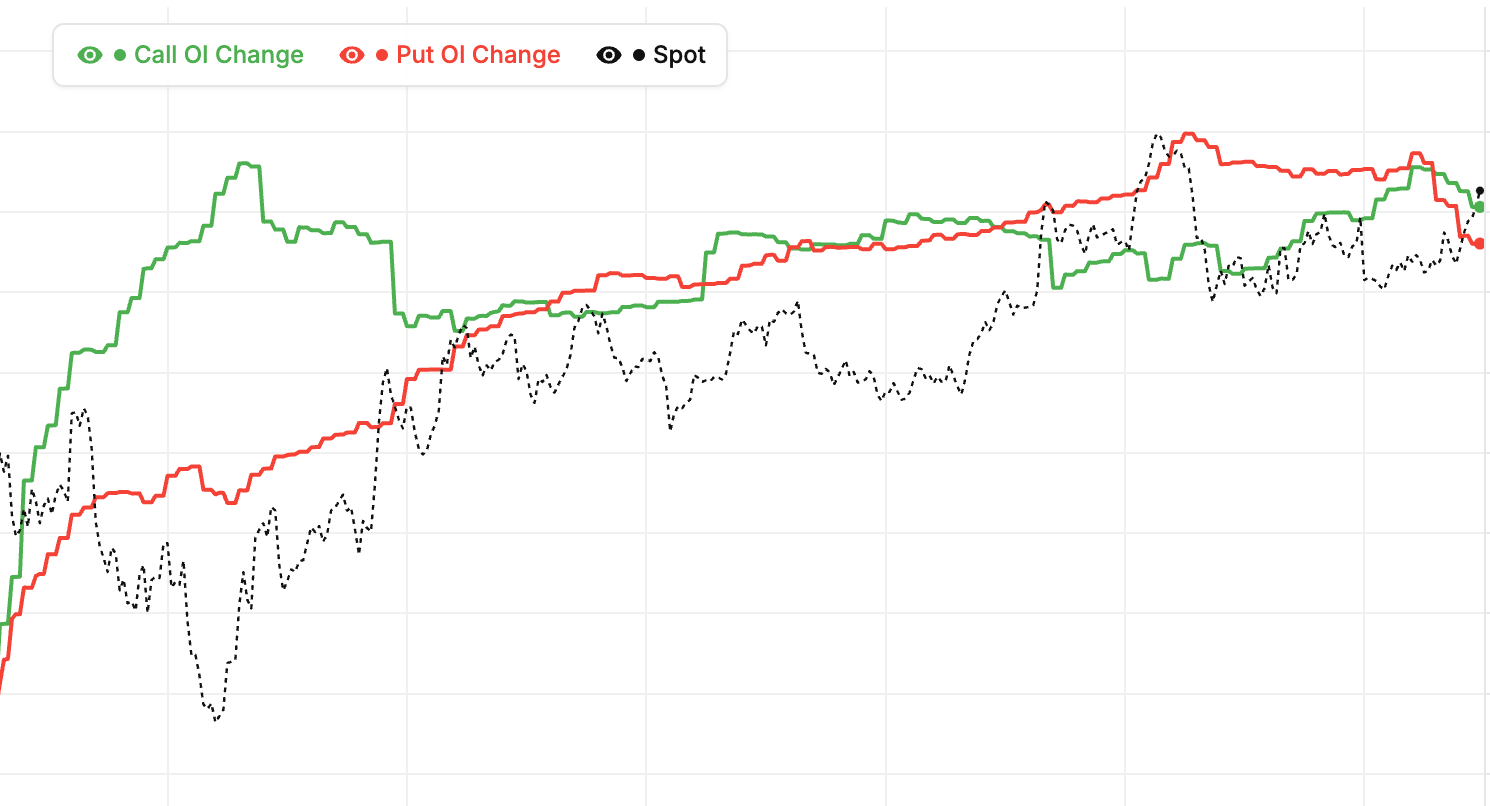
Price vs OI for TCS is the canonical framework for classifying what the market is actually doing beneath the surface of a price move. The four-phase cycle — long buildup, short buildup, long unwinding, and short covering — depends on whether price and open interest are moving together or apart. Our chart overlays TCS price and total option-chain OI so these phases become visible without any manual calculation.
Read the four states on TCS: price up with rising OI means fresh longs are being added (long buildup, genuinely bullish), price up with falling OI means shorts are exiting (short covering, technically bullish but usually shorter-lived), price down with rising OI means fresh shorts are entering (short buildup, genuinely bearish), and price down with falling OI means longs are capitulating (long unwinding, bearish but often close to exhaustion). The difference between buildup and covering is critical for judging whether a TCS move has legs or is about to stall.
Trading TCS divergences between price and OI
The most tradeable TCS signal is when price keeps moving but OI starts moving the other way. A TCS rally that continues even as OI declines is running on short-covering fuel — once shorts are done unwinding, the rally stalls. A TCS decline with falling OI is long unwinding — once longs have exited, selling pressure fades. These divergences often mark intraday tops and bottoms. Conversely, when price and OI keep moving together, the trend is supported by fresh positioning and tends to persist. Live mode tracks TCS price and OI in real time on NSE.
Combine Price vs OI with our Open Interest Analysis, Smart OI Detection, and Futures Intraday Chart for complete TCS positioning insight on NSE F&O.
Tata Consultancy Services Ltd (TCS) Price vs OI: Breakout Trade Setups
Confirming TCS breakouts with OI
A price breakout above resistance is more reliable when accompanied by rising OI. Fresh money is entering in the breakout direction — that is Long Buildup. These confirmed breakouts have much higher follow-through rates than breakouts without OI confirmation. For Tata Consultancy Services Ltd, always check OI before acting on a breakout signal.
False breakout warnings on TCS
If price breaks a level but OI is falling, the move is likely short covering — not fresh buying. Short covering rallies exhaust quickly. False breakouts often reverse sharply, trapping traders who entered on the initial move. The OI component on the chart warns you before you commit.
Breakdown confirmation on TCS
The same logic applies to breakdowns. Price breaking below support plus rising OI = fresh shorts entering = confirmed breakdown. Price breaking below with falling OI = long unwinding only = possibly temporary. The chart distinguishes between these two cases clearly.
Trade execution on confirmed TCS breakouts as of 13 October 2026
When a breakout is confirmed by OI, enter with full conviction. Use the broken level as your stop. Target the next significant level. Confirmed breakouts tend to reach their targets more reliably than unconfirmed ones, justifying slightly larger position sizes for the higher win rate.
Tata Consultancy Services Ltd (TCS) Price vs OI: Range-Bound Market Analysis
What a range-bound TCS chart looks like
In range-bound conditions, the Tata Consultancy Services Ltd Price vs OI chart shows price oscillating in a band while OI changes are modest. Both the OI line and price line stay relatively flat over time with small oscillations. This pattern indicates no strong directional conviction — the market is in equilibrium.
Trading ranges with Price vs OI
In ranges, buy near the low of the range and sell near the high. The chart helps confirm the range is holding — if OI patterns remain neutral at range edges, the range is stable. If you see buildup at the top or bottom, the range may be about to break.
Range breakout signals on TCS
A range breakout is more credible when the Price vs OI chart shows fresh buildup (price moving plus OI rising) in the direction of the break. The OI confirms fresh money is entering. Without this confirmation, the breakout is likely to reverse — treat it with caution.
Range-bound strategy for TCS as of 13 October 2026
In range-bound conditions, premium selling strategies (iron condors, short strangles) work well. Directional trades underperform. Use the Price vs OI chart to confirm the range is stable before committing to premium-selling positions that depend on price staying contained.
Tata Consultancy Services Ltd (TCS) Price vs OI: Daily Routine
Pre-market TCS check
Review the previous day's Price vs OI chart. Which buildup pattern dominated? Did divergences appear? Note the ending pattern — it usually carries into the next session. This 2-minute review sets your framework for the day.
Opening-hour monitoring on TCS
Watch the first hour of trading. Does the active pattern match yesterday's, or is something different forming? Early divergences from expectations mean today may be unusual. Adjust your trading plan accordingly.
Mid-day reassessment on TCS
Around midday, check the chart again. How has the pattern evolved? Is conviction building or fading? Mid-session updates let you adjust open positions and spot entries for the afternoon. Do not ignore this check — the picture can shift significantly between morning and midday.
End-of-day review on TCS as of 13 October 2026
At close, review the full day's chart. Document the dominant pattern, any reversals, and significant divergences. This journal becomes your training data for pattern recognition over time. The daily discipline compounds into intuition that no generic guide can teach.
TCS option premium vs OI: quick reference
| Premium + OI | Option buildup | Read at the strike |
|---|---|---|
| Premium up + OI up | Long buildup | Fresh buyers lifting this TCS option — genuine demand at the strike |
| Premium down + OI up | Short buildup | Fresh writing on this contract — the strike is being capped or defended |
| Premium up + OI down | Short covering | Writers buying back — a premium pop that usually fades once covering ends |
| Premium down + OI down | Long unwinding | Option buyers exiting — interest draining out of the strike |
This matrix reads the premium of a single TCS option against its own open interest, so the StockMojo CE and PE Price vs OI panels tell you whether call writers or put writers are building positions at the selected strike. That is a different question from the underlying buildup shown in the price panel above — pair the two to judge whether the strike is likely to hold or break.
How to use Price vs OI analysis
- Choose symbol and time frame — Pick Nifty, BankNifty, or any F&O stock. Select live or historical mode.
- Classify the current phase — Check whether price and OI are both up (long buildup), both down (long unwinding), or divergent (short buildup or short covering).
- Look for divergences — The most tradeable signals come when price and OI diverge — these often mark intraday or multi-day reversals.
- Confirm with volume — Fresh buildup is most reliable when volume is also expanding. Buildup on thin volume is weaker commitment and fails more often.
- Time entries on phase transitions — The cleanest entries come at the moment a phase changes — for example, a shift from long unwinding to long buildup marks a regime change.
TCS Price vs OI — Frequently Asked Questions
What is TCS Price vs OI divergence?
TCS Price vs OI divergence is when price and open interest move in opposite directions instead of confirming each other. A rally that keeps rising while OI falls is short covering running out of fuel; a decline that continues while OI falls is long unwinding nearing exhaustion. Both patterns often precede a near-term reversal on NSE.
How to interpret TCS OI buildup?
Read TCS OI buildup with the four-quadrant matrix. Price up with OI up is long buildup (fresh bullish positioning); price down with OI up is short buildup (fresh bearish positioning); price up with OI down is short covering (a weaker rally); price down with OI down is long unwinding (a weaker decline).
Is TCS Price vs OI analysis reliable?
TCS Price vs OI analysis is reliable as a confirmation tool, not a standalone signal. Rising OI in the direction of a move confirms genuine commitment and follow-through, while falling OI warns the move is only position-squaring. It works best on clear moves of at least 0.3-0.5% and loses accuracy inside tight, choppy ranges.
What do the TCS call and put Price vs OI charts show?
The TCS call (CE) and put (PE) Price vs OI charts track each option's premium against its own open interest at the selected strike. Rising premium with rising OI signals fresh option buying at that strike; falling premium with rising OI signals fresh writing. Reading CE and PE side by side shows which side traders are defending.
How often does TCS Price vs OI data update?
During NSE market hours (9:15 AM to 3:40 PM IST) the TCS Price vs OI charts refresh every few seconds in sync with the live option chain and futures feed. Outside market hours they show the last traded session, and historical mode replays TCS price and OI for any past date at minute-level detail.
Learn more
Read our guide: Long Buildup vs Short Buildup: Reading OI Change with Price