INFY Price vs Open Interest | Live Buildup & Unwinding
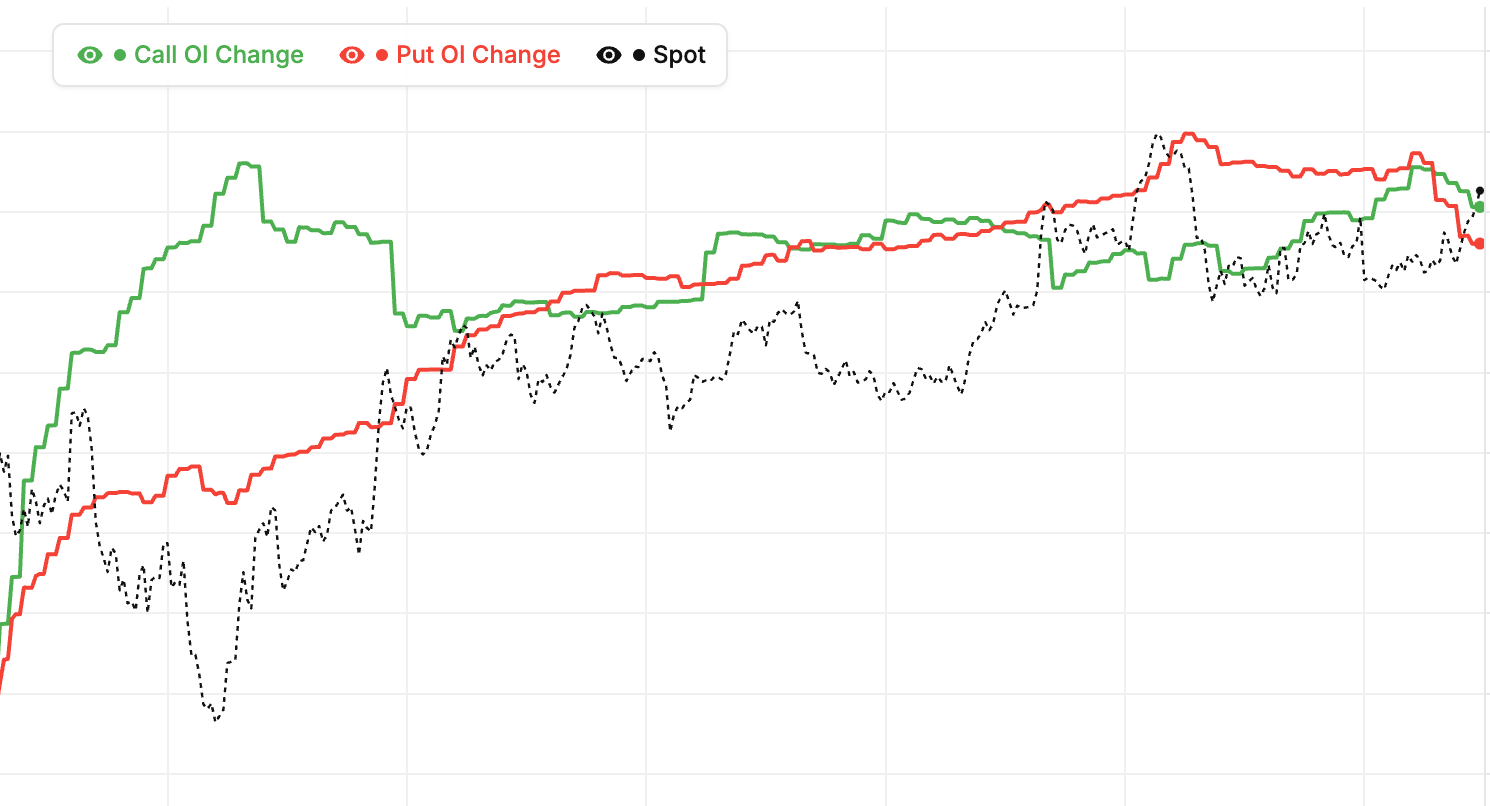
Price vs OI for INFY is the canonical framework for classifying what the market is actually doing beneath the surface of a price move. The four-phase cycle — long buildup, short buildup, long unwinding, and short covering — depends on whether price and open interest are moving together or apart. Our chart overlays INFY price and total option-chain OI so these phases become visible without any manual calculation.
Read the four states on INFY: price up with rising OI means fresh longs are being added (long buildup, genuinely bullish), price up with falling OI means shorts are exiting (short covering, technically bullish but usually shorter-lived), price down with rising OI means fresh shorts are entering (short buildup, genuinely bearish), and price down with falling OI means longs are capitulating (long unwinding, bearish but often close to exhaustion). The difference between buildup and covering is critical for judging whether a INFY move has legs or is about to stall.
Trading INFY divergences between price and OI
The most tradeable INFY signal is when price keeps moving but OI starts moving the other way. A INFY rally that continues even as OI declines is running on short-covering fuel — once shorts are done unwinding, the rally stalls. A INFY decline with falling OI is long unwinding — once longs have exited, selling pressure fades. These divergences often mark intraday tops and bottoms. Conversely, when price and OI keep moving together, the trend is supported by fresh positioning and tends to persist. Live mode tracks INFY price and OI in real time on NSE.
Combine Price vs OI with our Open Interest Analysis, Smart OI Detection, and Futures Intraday Chart for complete INFY positioning insight on NSE F&O.
Infosys Ltd (INFY) Price vs OI: Reading the Two Together
What does the INFY Price vs OI chart show?
The Price vs OI chart for Infosys Ltd (INFY) plots price alongside open interest on the same chart. Watching them together reveals much more than either alone. Price tells you direction; OI tells you commitment. When they agree, trends have conviction. When they diverge, a reversal may be brewing.
Why watch both simultaneously on INFY
Price moves without OI confirmation are suspect — they could be thin trades without real support. OI changes without price movement signal positioning without immediate impact. Only when price and OI move together do you have full confirmation of what is happening on INFY. The chart makes this simultaneous view easy.
Who uses Price vs OI analysis on INFY?
Serious traders and institutional desks use price-OI combined analysis for all their directional decisions. As a NIFTY constituent, Infosys Ltd sees enough OI depth that the analysis is reliable. Retail traders who learn to read the two together gain a significant edge over those who use only price charts.
Starting with the chart today
As of 13 October 2026, pull up the INFY Price vs OI chart and watch how they move. Note periods when they move together versus periods when they diverge. The simple observation of these relationships builds intuition faster than any textbook explanation.
Infosys Ltd (INFY) Price vs OI: Historical Mode Analysis
Why study historical INFY data?
Historical mode lets you replay how Infosys Ltd price and OI moved on any past trading day. You see the patterns that preceded significant moves. This retrospective analysis teaches pattern recognition in a way live trading cannot because you only see one day at a time.
Study routine for INFY historical patterns
Each weekend, pick one major INFY move from the past week. Pull up the Price vs OI chart for 5 days before and 2 days after. Identify: which buildup pattern appeared before the move? Did OI confirm the move as it started? What divergences appeared? Document your observations.
Building a INFY pattern library
Over months of study, you accumulate a library of patterns specific to Infosys Ltd. Certain setups appear repeatedly. When today's live chart starts matching a library entry, you have context for what might happen next. Pattern matching is how experienced traders develop intuition.
Using the library for live trades on INFY as of 13 October 2026
When today's chart reminds you of a historical pattern, check your journal notes. What happened last time? Was it a reliable setup? Use this historical context to calibrate your confidence for today's trade. Over time, pattern recognition becomes an intuitive edge that beats pure theory.
Infosys Ltd (INFY) Price vs OI: Frequently Asked Questions
How do I read the INFY Price vs OI chart?
Start with the four buildup patterns — Long Buildup, Short Buildup, Long Unwinding, Short Covering. Identify which pattern currently applies based on price and OI directions. Use the active pattern to interpret market conditions for Infosys Ltd. Over time, pattern recognition becomes second nature.
Which pattern is bullish for INFY?
Long Buildup (price up, OI up) is the strongest bullish pattern. Short Covering (price up, OI down) is weaker bullish. Both indicate bullish direction but with different conviction levels. Long Buildup trends are more reliable for holding positions.
Which pattern is bearish for INFY?
Short Buildup (price down, OI up) is the strongest bearish pattern. Long Unwinding (price down, OI down) is weaker bearish. Short Buildup trends have real downside conviction; Long Unwinding often represents temporary selling that reverses.
Can beginners use this chart on INFY as of 13 October 2026
Yes. The four buildup patterns are simple to learn. Spend a few sessions observing the chart before trading. Identify the current pattern at various points in the day. After 1-2 weeks of observation, you can start using the patterns for actual trade decisions on Infosys Ltd.
INFY option premium vs OI: quick reference
| Premium + OI | Option buildup | Read at the strike |
|---|---|---|
| Premium up + OI up | Long buildup | Fresh buyers lifting this INFY option — genuine demand at the strike |
| Premium down + OI up | Short buildup | Fresh writing on this contract — the strike is being capped or defended |
| Premium up + OI down | Short covering | Writers buying back — a premium pop that usually fades once covering ends |
| Premium down + OI down | Long unwinding | Option buyers exiting — interest draining out of the strike |
This matrix reads the premium of a single INFY option against its own open interest, so the StockMojo CE and PE Price vs OI panels tell you whether call writers or put writers are building positions at the selected strike. That is a different question from the underlying buildup shown in the price panel above — pair the two to judge whether the strike is likely to hold or break.
How to use Price vs OI analysis
- Choose symbol and time frame — Pick Nifty, BankNifty, or any F&O stock. Select live or historical mode.
- Classify the current phase — Check whether price and OI are both up (long buildup), both down (long unwinding), or divergent (short buildup or short covering).
- Look for divergences — The most tradeable signals come when price and OI diverge — these often mark intraday or multi-day reversals.
- Confirm with volume — Fresh buildup is most reliable when volume is also expanding. Buildup on thin volume is weaker commitment and fails more often.
- Time entries on phase transitions — The cleanest entries come at the moment a phase changes — for example, a shift from long unwinding to long buildup marks a regime change.
INFY Price vs OI — Frequently Asked Questions
What is INFY Price vs OI divergence?
INFY Price vs OI divergence is when price and open interest move in opposite directions instead of confirming each other. A rally that keeps rising while OI falls is short covering running out of fuel; a decline that continues while OI falls is long unwinding nearing exhaustion. Both patterns often precede a near-term reversal on NSE.
How to interpret INFY OI buildup?
Read INFY OI buildup with the four-quadrant matrix. Price up with OI up is long buildup (fresh bullish positioning); price down with OI up is short buildup (fresh bearish positioning); price up with OI down is short covering (a weaker rally); price down with OI down is long unwinding (a weaker decline).
Is INFY Price vs OI analysis reliable?
INFY Price vs OI analysis is reliable as a confirmation tool, not a standalone signal. Rising OI in the direction of a move confirms genuine commitment and follow-through, while falling OI warns the move is only position-squaring. It works best on clear moves of at least 0.3-0.5% and loses accuracy inside tight, choppy ranges.
What do the INFY call and put Price vs OI charts show?
The INFY call (CE) and put (PE) Price vs OI charts track each option's premium against its own open interest at the selected strike. Rising premium with rising OI signals fresh option buying at that strike; falling premium with rising OI signals fresh writing. Reading CE and PE side by side shows which side traders are defending.
How often does INFY Price vs OI data update?
During NSE market hours (9:15 AM to 3:40 PM IST) the INFY Price vs OI charts refresh every few seconds in sync with the live option chain and futures feed. Outside market hours they show the last traded session, and historical mode replays INFY price and OI for any past date at minute-level detail.
Learn more
Read our guide: Long Buildup vs Short Buildup: Reading OI Change with Price