SENSEX Multi-Strike Vol/OI | Live Turnover Across Strikes
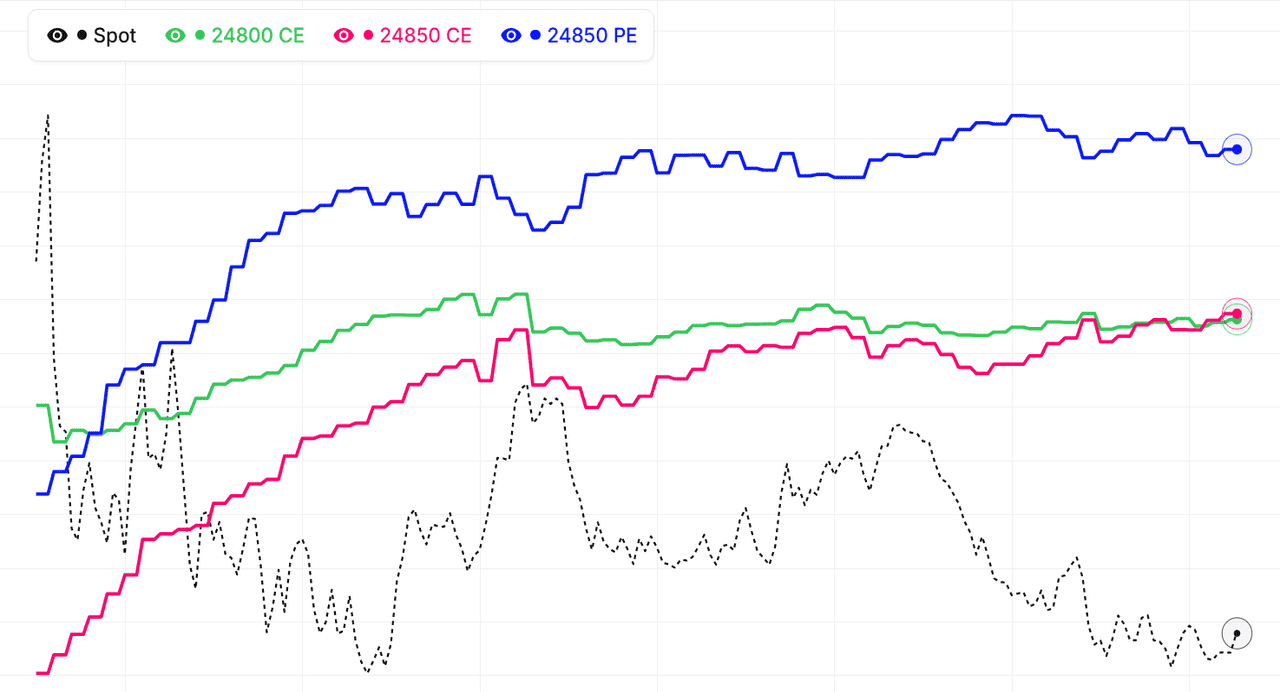
The multi-strike Vol/OI view for SENSEX divides traded option volume by open interest for several strikes on a single chart — the turnover footprint across the option chain instead of one strike at a time. A high Vol/OI at a SENSEX strike means the position there is being churned heavily; a low reading means the open interest is largely sitting still.
The tool shows Total Vol/OI (cumulative volume ÷ OI) and Interval Vol/OI (per-minute volume ÷ OI) for both calls and puts. Because Vol/OI normalises activity by the size of the position base, it surfaces heavily-traded strikes that raw volume or raw OI charts can miss. Live mode keeps each strike's Vol/OI updated across the NSE session.
Reading the SENSEX Vol/OI footprint
High Vol/OI with rising open interest means fresh positions are being built and worked aggressively. High Vol/OI with flat OI is intraday churn — common at the ATM strike on expiry day. A sudden interval Vol/OI burst at a quiet strike is an early warning that the level is coming into play.
Combine multi-strike Vol/OI with our Multi-Strike OI, Multi-Strike Volume, and Live Option Chain to build a full picture of SENSEX NSE option-market activity.
SENSEX Vol/OI turnover: quick reference
| Total Vol/OI | OI trend | Typical reading |
|---|---|---|
| Below 0.5 | Any | Dormant strike; positions parked, little active interest |
| 0.5 – 1 | Rising | Steady fresh positioning being added at the strike |
| 1 – 3 | Rising | Active build-up; new SENSEX positions worked aggressively |
| 1 – 3 | Flat | Intraday churn; common at the ATM strike on expiry day |
| Above 3 | Falling | Rapid unwinding; positions closed faster than they are replaced |
These combinations are tendencies observed on liquid NSE strikes, not fixed rules — always read Vol/OI against the raw OI and volume views before acting. The live SENSEX charts above recompute both Total and Interval Vol/OI through the session, so you can see which regime each of your selected strikes is trading in.
How to use Multistrike Vol/OI
- Pick an underlying and expiry — Choose Nifty, BankNifty, or an F&O stock and select the expiry you want to analyse.
- Select strikes to compare — Use High Volume or High OI auto-selection to load the most active strikes, or pick custom strikes around your key levels.
- Read Total Vol/OI — The top chart shows cumulative volume ÷ OI — how thoroughly the open interest has been traded through today, for calls and puts.
- Watch Interval Vol/OI — The bottom chart shows per-minute volume ÷ OI. Spikes flag the exact moments turnover surges at a level.
- Confirm with OI and Volume — Switch to the Multistrike OI or Volume views to see whether the turnover is building positions or just churning them.
SENSEX MultiStrike Vol/OI — Frequently Asked Questions
What is SENSEX MultiStrike Vol/OI?
SENSEX MultiStrike Vol/OI divides traded option volume by open interest for multiple strikes on one view. It measures turnover — how many times the outstanding position at a strike has changed hands — helping identify where the option market is actively working, not just where volume or OI is largest.
How to read SENSEX Vol/OI charts?
Watch the Total Vol/OI chart for how thoroughly the day's open interest has been traded, and the Interval Vol/OI chart for minute-by-minute turnover spikes. Compare the Call and Put lines, and confirm with the Multi-Strike OI and Volume views to see whether the churn is building positions or unwinding them.
What does a high Vol/OI reading at a SENSEX strike mean?
A high Vol/OI means the SENSEX strike is being churned heavily relative to the positions held there. With rising open interest it signals fresh positions being built and worked aggressively; with flat OI it is intraday churn, common at the ATM strike on expiry day. A sudden interval spike at a quiet strike often flags a level coming into play.
What is a normal Vol/OI ratio for SENSEX options?
There is no single normal, but on liquid SENSEX ATM strikes total Vol/OI typically runs between 1 and 3 during a session, while far OTM strikes often stay below 0.5. On expiry day the ATM ratio can exceed 5 as gamma scalping intensifies. Compare a strike against its neighbours rather than against a fixed threshold.
How often does SENSEX MultiStrike Vol/OI update?
During NSE market hours (9:15 AM to 3:40 PM IST) the SENSEX MultiStrike Vol/OI charts refresh on the same cadence as the option chain, recomputing volume ÷ open interest each cycle. The Interval chart flags turnover spikes minute by minute, while historical mode lets you replay past SENSEX sessions strike by strike.
Learn more
Read our guide: Open Interest vs Volume in Options: The Difference That Matters