TCS Volatility Skew & Smile | Live IV Distribution
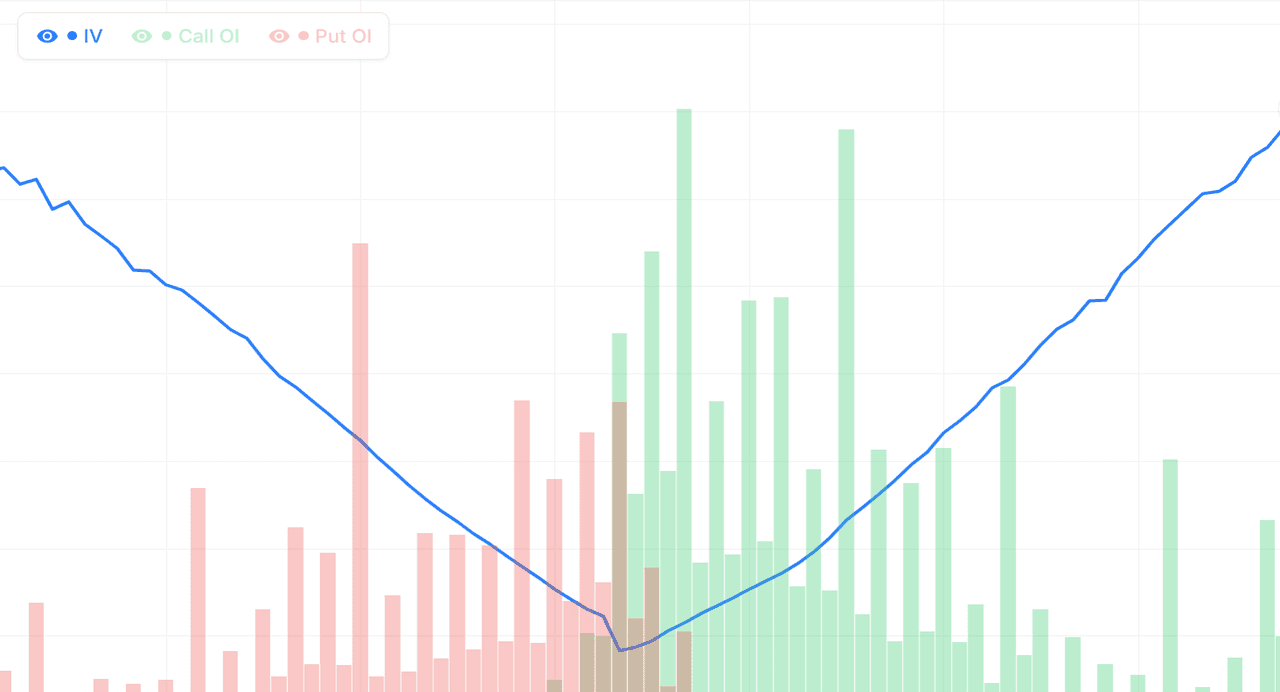
Implied volatility across TCS option strikes is almost never flat — it forms a characteristic smile or skew shape that reflects how the market prices tail risk. Our volatility skew tool plots IV at every strike for each TCS expiry, so you can see at a glance whether out-of-the-money puts are trading at a premium (the classic downside skew typical of Indian indices), whether the smile is flat (complacent market), or whether calls are unusually expensive (a sign of buy-side demand and potential squeeze risk).
The TCS IV surface is a richer read. By comparing skew across the near, mid, and far expiries, you can tell whether the market is pricing event-specific risk (skew spikes only in the relevant expiry) or structural fear (skew is elevated across all expiries). A steepening skew in TCS during an up-move often signals that sophisticated traders are buying protection against a reversal, while a flattening skew during a sell-off tells you downside hedges are being unwound — often an early sign of a bottom.
Trading TCS with volatility skew
Premium-selling strategies on TCS benefit from trading the rich side of the skew — for example, selling the overpriced TCS OTM puts when downside skew is unusually steep, or selling expensive calls when the smile is flipped. Risk-reversal structures (long call, short put or vice versa) let you isolate and trade the skew itself rather than direction. For directional traders, a sudden flattening of skew alongside a price rally is a textbook confirmation of a sustained move. Live mode streams skew updates through each NSE session.
Combine volatility skew with our IV Chart, IV Grid Screener, and ATM Straddle Chart for comprehensive TCS implied volatility analysis.
Tata Consultancy Services Ltd (TCS) Skew Before Major Events
How does the TCS skew change before events?
Before major events, the Tata Consultancy Services Ltd volatility skew typically steepens significantly. Institutions buy protective puts, driving up put IV. Retail speculators may also buy OTM calls, increasing call IV somewhat. But the put effect usually dominates, leading to a more pronounced smirk. Tata Consultancy Services Ltd earnings, board meetings, and regulatory events are common triggers for pre-event skew steepening.
Identifying pre-event skew inflation on TCS
Watch for put IV growing faster than call IV in the 3-5 sessions before a known event. A normal 6-point skew might steepen to 10-12 points as the event approaches. This steepening represents inflated put premiums and creates opportunities for traders willing to sell expensive protection. It also warns that option buyers are paying more for downside insurance — the market is genuinely worried.
Post-event skew behaviour on TCS
Once the event resolves, the TCS skew typically flattens sharply as the fear premium unwinds. The put IV crashes faster than call IV because the protective hedge is no longer needed. Within 1-2 sessions of the event, the skew returns to normal levels. Traders who sold inflated pre-event puts capture profit as both the overall IV and the specific put premium normalise.
Trading the TCS skew around events
The classic event trade: sell expensive OTM puts before the event and hold through the announcement. Maximum risk is the put strike moving into the money, but the fear premium often collapses even if direction is mildly bearish. Another approach: avoid trading skew around events entirely because the risk is high and the timing is critical. Beginners should start with observation before attempting event-driven skew trades. As of 13 October 2026, respect the uncertainty of events and size positions conservatively.
Tata Consultancy Services Ltd (TCS) Skew: Sector and Index Context
How TCS skew reflects broader conditions
As a NIFTY constituent, Tata Consultancy Services Ltd skew does not exist in isolation. It is influenced by global market conditions, domestic economic data, and the specific IT sector dynamics. A steepening skew on TCS often mirrors rising fear in global markets or specific domestic concerns. Understanding the broader context helps you interpret whether the skew is driven by TCS-specific factors or external forces.
Tata Consultancy Services Ltd skew vs sector peers
Compare the Tata Consultancy Services Ltd skew with the NIFTY index skew. If TCS shows steeper skew than the index, something specific to the stock or sector is driving extra fear. This relative skew analysis reveals stock-specific risks that are not captured in index-level data.
Global influences on TCS skew
For Tata Consultancy Services Ltd, global factors matter during broad market moves. Domestic events dominate during quiet global periods. Always check whether today's skew change is global-driven or domestic-driven.
Using cross-market comparison for TCS trades
If Tata Consultancy Services Ltd skew is steepening but global markets are calm, the fear might be local and potentially overdone (opportunity to sell expensive protection). If both are steepening, the fear is broad and likely justified (avoid selling protection). This context-aware approach prevents you from fading fear that is actually warranted. As of 13 October 2026, reading skew in context of broader markets is a key skill for sophisticated TCS traders.
Tata Consultancy Services Ltd (TCS) Skew: Risk Management
Why skew trades require careful risk management
Skew trades often involve selling options — sold puts in a steep skew environment, sold calls in a flat-call environment. Sold options have unlimited theoretical risk. Even limited-risk structures like vertical spreads can suffer large losses if Tata Consultancy Services Ltd moves sharply against you. Without careful risk management, skew trades can produce a few winners followed by one catastrophic loss that wipes out all gains.
Position sizing for TCS skew trades
Keep position sizes small. Rule of thumb: never risk more than 2% of your trading capital on a single Tata Consultancy Services Ltd skew trade. For sold-put trades, calculate the worst-case loss (put strike minus zero, times contract size) and size so that even a 100% loss would be within your limit. This conservative sizing ensures survival during adverse events.
Stop-loss discipline on TCS skew trades
Set hard stops at specific TCS price levels, not arbitrary percentages. If you sold a put at 22000, your stop might be at 21700 spot — if Tata Consultancy Services Ltd hits that level, close the position. Never average down on a losing skew trade. The temptation to add is strong because you believe the skew will normalise, but sometimes the market is right and you are wrong. Respect the stop-loss regardless of your prior thesis.
Diversification across TCS trades
Do not concentrate all your capital in skew trades. Mix with other strategies — directional, range-bound, trend-following. Different strategies perform differently in different market conditions, and diversification smooths out your equity curve. For TCS traders, a balanced portfolio of 4-6 different strategy types is more robust than relying heavily on skew trades alone. As of 13 October 2026, diversification is the most underrated form of risk management.
Volatility Skew: Video Walkthrough
TCS volatility skew shapes: quick reference
| Skew shape | IV pattern across strikes | Positioning read |
|---|---|---|
| Steep put skew | OTM puts far above calls | Heavy downside hedging; fear rising; contrarian top risk at extremes |
| Mild put skew (normal) | OTM puts modestly above calls | Healthy TCS baseline; routine protection demand |
| Flat skew | Puts ≈ calls, curve nearly level | Complacency; low hedging demand; often a late-stage rally |
| Volatility smile | Both OTM wings above ATM IV | Two-sided tail risk; common around TCS events or results |
| Call-side (reverse) skew | OTM calls out-price puts | Speculative upside or squeeze demand; rare on indices |
On NSE indices a mild-to-steep put skew is the resting state, so the signal is in the change: a skew that steepens into a rally warns of hedging before a top, while one that flattens into a sell-off often marks capitulation near a bottom. Compare today's TCS curve against the T-day overlay above to judge whether the current shape is stretched.
How to read the Volatility Skew chart
- Select symbol and expiry — Choose Nifty, BankNifty, or any F&O stock and pick a weekly or monthly expiry.
- Identify the skew direction — Check whether IV is higher on the put side (downside skew, common for indices) or call side (upside skew, common in momentum stocks).
- Compare versus history — Toggle historical T-day overlay to see whether today's skew is unusually steep or flat versus the past 5 sessions.
- Spot the lowest-IV strike — Locate where IV bottoms. This is the market's implied forward price and the natural ATM reference.
- Pick your strategy bias — Use steep skew for premium-selling (sell the rich side), flat skew for long-volatility plays, and skew transitions for directional entries.
TCS Volatility Skew — Frequently Asked Questions
What is TCS volatility skew?
Volatility skew is the pattern of implied volatility plotted across strike prices for one TCS expiry. In theory IV should be flat; in practice it slopes. TCS options usually show put skew — out-of-the-money puts price at higher IV than equidistant calls — because traders pay up for downside protection.
Why do TCS options usually show a put skew?
Put skew reflects structural hedging demand. Funds and institutions holding TCS exposure continuously buy out-of-the-money puts to protect portfolios, lifting put-side IV above call-side IV. Index sell-offs are also faster and sharper than rallies, so puts carry a permanent risk premium. Even in strong uptrends the TCS put skew rarely disappears — it only flattens.
What does a steepening TCS volatility skew mean?
A steepening skew means out-of-the-money TCS put IV is rising faster than call IV, so hedging demand and fear are increasing. It often appears while spot is still climbing, marking sophisticated desks buying protection before a reversal. At extremes steep put skew is a contrarian caution signal that a pullback may be near.
What does flat or call-side skew tell me on TCS?
A flat TCS skew signals complacency — puts and calls price at similar IV, meaning little hedging demand and often a late-stage rally. Call-side or reverse skew, where OTM calls out-price puts, points to speculative upside demand or squeeze risk. Both are unusual for indices and worth watching as sentiment extremes.
How often does the TCS volatility skew chart update?
During NSE market hours (9:15 AM to 3:40 PM IST) the TCS volatility skew chart refreshes every minute from live option-chain IV across strikes. Outside market hours it shows the last traded session, and historical mode lets you replay the TCS skew curve for any past expiry to study how it behaved around events.
Learn more
Read our guide: Implied Volatility (IV) Explained for Indian F&O Traders