RELIANCE Volatility Skew & Smile | Live IV Distribution
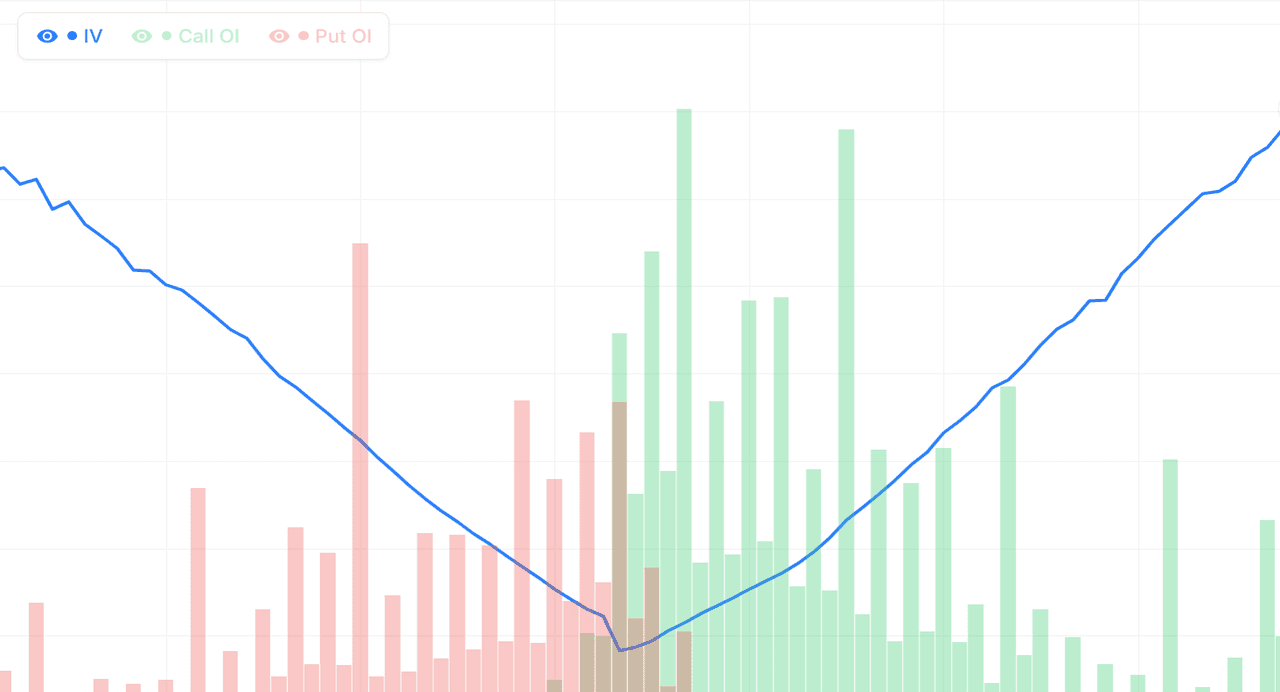
Implied volatility across RELIANCE option strikes is almost never flat — it forms a characteristic smile or skew shape that reflects how the market prices tail risk. Our volatility skew tool plots IV at every strike for each RELIANCE expiry, so you can see at a glance whether out-of-the-money puts are trading at a premium (the classic downside skew typical of Indian indices), whether the smile is flat (complacent market), or whether calls are unusually expensive (a sign of buy-side demand and potential squeeze risk).
The RELIANCE IV surface is a richer read. By comparing skew across the near, mid, and far expiries, you can tell whether the market is pricing event-specific risk (skew spikes only in the relevant expiry) or structural fear (skew is elevated across all expiries). A steepening skew in RELIANCE during an up-move often signals that sophisticated traders are buying protection against a reversal, while a flattening skew during a sell-off tells you downside hedges are being unwound — often an early sign of a bottom.
Trading RELIANCE with volatility skew
Premium-selling strategies on RELIANCE benefit from trading the rich side of the skew — for example, selling the overpriced RELIANCE OTM puts when downside skew is unusually steep, or selling expensive calls when the smile is flipped. Risk-reversal structures (long call, short put or vice versa) let you isolate and trade the skew itself rather than direction. For directional traders, a sudden flattening of skew alongside a price rally is a textbook confirmation of a sustained move. Live mode streams skew updates through each NSE session.
Combine volatility skew with our IV Chart, IV Grid Screener, and ATM Straddle Chart for comprehensive RELIANCE implied volatility analysis.
Reliance Industries Ltd (RELIANCE) Skew: Pro Tips
Tip 1: Track the RELIANCE 20-day skew average
A single-day skew reading is noisy. The 20-day average smooths out the noise and reveals the underlying trend. Is the current skew above or below its 20-day average? How does it compare to 60-day and 90-day averages? These moving averages provide context that raw numbers cannot. A skew above all its averages is consistently elevated — real fear is present. A skew below all its averages is consistently compressed — complacency is real.
Tip 2: Watch for RELIANCE skew divergences
When price and skew move in different directions, the market is telling you something. Price rising with skew steepening = fake rally. Price falling with skew flattening = bottoming out. Noticing these divergences gives you leading indicators that most traders miss. Practice recognising them on historical data until the pattern becomes intuitive.
Tip 3: Use RELIANCE skew as a filter, not a signal
The best use of skew analysis for most traders is as a filter. Run your normal trading plan, and before entering each trade, check what the skew says. If the skew supports your trade direction (bullish setup + flattening skew), proceed with normal size. If the skew contradicts (bullish setup + steepening skew), reduce size or skip. This filter approach improves trade selection without requiring skew-specific strategies.
Tip 4: Build RELIANCE skew pattern recognition
The most valuable skill is intuitive pattern recognition — knowing what a steep skew looks like on Reliance Industries Ltd without calculating numbers. This comes from spending time with the chart. Observe 20+ sessions, note the range of shapes you see, and build a mental library. After 2-3 months of consistent observation, you will identify unusual skews in seconds. As of 13 October 2026, this pattern recognition is the difference between traders who use skew effectively and those who never progress past reading generic tutorials. As a NIFTY constituent, Reliance Industries Ltd provides enough daily skew data to develop this skill efficiently.
Reliance Industries Ltd (RELIANCE) Skew: Put Skew and Risk Reversal
What is the put skew on RELIANCE?
The put skew is the tendency for OTM put IV to be higher than OTM call IV on Reliance Industries Ltd options. It is the dominant feature of equity-index skew globally and persists because of structural demand for downside protection. Traders, portfolio managers, and risk managers all use RELIANCE puts to hedge their equity exposure. This constant demand keeps put IV elevated relative to call IV.
What is a risk reversal strategy on RELIANCE?
A risk reversal is a strategy that specifically exploits the put skew. You sell an OTM put (which has high IV and rich premium) and use the proceeds to buy an OTM call (which has lower IV and is relatively cheaper). The net cost is low or zero, but you benefit from upside movement. The tradeoff is that you take on downside risk — if Reliance Industries Ltd falls sharply, the sold put can hurt you. The strategy is bullish with asymmetric exposure.
When to use RELIANCE risk reversals
Risk reversals work best when: 1) You are moderately bullish on Reliance Industries Ltd. 2) The put skew is steep (creating a cheap call-buying opportunity). 3) You can tolerate the downside risk of the sold put. 4) Time to expiry is 2-4 weeks (long enough for directional move, short enough to manage). Avoid risk reversals when you are uncertain about direction or when the put skew is already flat.
Risk management for RELIANCE risk reversals
The sold put is the main risk. Set a stop-loss at a specific Reliance Industries Ltd price below the sold strike — if that level is hit, close the entire structure. Never hold a losing risk reversal into the put strike. As of 13 October 2026, professional traders use risk reversals for directional bets with minimal capital outlay, but they are strict about stop-loss discipline. Beginners should practice with paper trades before using real money.
Reliance Industries Ltd (RELIANCE) Skew: Frequently Asked Questions
What is a normal skew level for RELIANCE?
For Reliance Industries Ltd, a typical skew shows OTM put IV about 4-8 percentage points higher than equidistant OTM call IV. Anything below 3 points is unusually flat; above 10 is steep. These ranges shift over time — what is "normal" today might not be normal next year. Build a baseline by tracking the skew over 20-30 sessions to establish your own normal range.
How often should I check the RELIANCE skew?
For positional traders, once per session at the end of the day is enough. For day traders, 2-3 times per session (opening, midday, final hour). For skew-focused strategies, monitoring the chart throughout the session is appropriate. The right frequency depends on your trading style and how directly you use skew for decisions.
Can beginners use the RELIANCE skew chart?
Yes, but as a sentiment indicator first and a trading signal second. Beginners should start by simply observing how the Reliance Industries Ltd skew moves through different market conditions. After 4-6 weeks of observation, you understand the basic patterns and can start using the skew to filter other trades. Attempting to trade skew directly without observation experience usually leads to losses.
What other tools complement RELIANCE skew analysis?
Skew works well with: the IV chart (overall IV levels), option chain (OI distribution and strike-level data), VIX (broad market volatility), and PCR (sentiment measure). Using skew alongside 2-3 other tools gives you a multi-indicator view that is much more reliable than any single signal. As of 13 October 2026, sophisticated traders build dashboards that show all these tools at once for Reliance Industries Ltd.
Volatility Skew: Video Walkthrough
RELIANCE volatility skew shapes: quick reference
| Skew shape | IV pattern across strikes | Positioning read |
|---|---|---|
| Steep put skew | OTM puts far above calls | Heavy downside hedging; fear rising; contrarian top risk at extremes |
| Mild put skew (normal) | OTM puts modestly above calls | Healthy RELIANCE baseline; routine protection demand |
| Flat skew | Puts ≈ calls, curve nearly level | Complacency; low hedging demand; often a late-stage rally |
| Volatility smile | Both OTM wings above ATM IV | Two-sided tail risk; common around RELIANCE events or results |
| Call-side (reverse) skew | OTM calls out-price puts | Speculative upside or squeeze demand; rare on indices |
On NSE indices a mild-to-steep put skew is the resting state, so the signal is in the change: a skew that steepens into a rally warns of hedging before a top, while one that flattens into a sell-off often marks capitulation near a bottom. Compare today's RELIANCE curve against the T-day overlay above to judge whether the current shape is stretched.
How to read the Volatility Skew chart
- Select symbol and expiry — Choose Nifty, BankNifty, or any F&O stock and pick a weekly or monthly expiry.
- Identify the skew direction — Check whether IV is higher on the put side (downside skew, common for indices) or call side (upside skew, common in momentum stocks).
- Compare versus history — Toggle historical T-day overlay to see whether today's skew is unusually steep or flat versus the past 5 sessions.
- Spot the lowest-IV strike — Locate where IV bottoms. This is the market's implied forward price and the natural ATM reference.
- Pick your strategy bias — Use steep skew for premium-selling (sell the rich side), flat skew for long-volatility plays, and skew transitions for directional entries.
RELIANCE Volatility Skew — Frequently Asked Questions
What is RELIANCE volatility skew?
Volatility skew is the pattern of implied volatility plotted across strike prices for one RELIANCE expiry. In theory IV should be flat; in practice it slopes. RELIANCE options usually show put skew — out-of-the-money puts price at higher IV than equidistant calls — because traders pay up for downside protection.
Why do RELIANCE options usually show a put skew?
Put skew reflects structural hedging demand. Funds and institutions holding RELIANCE exposure continuously buy out-of-the-money puts to protect portfolios, lifting put-side IV above call-side IV. Index sell-offs are also faster and sharper than rallies, so puts carry a permanent risk premium. Even in strong uptrends the RELIANCE put skew rarely disappears — it only flattens.
What does a steepening RELIANCE volatility skew mean?
A steepening skew means out-of-the-money RELIANCE put IV is rising faster than call IV, so hedging demand and fear are increasing. It often appears while spot is still climbing, marking sophisticated desks buying protection before a reversal. At extremes steep put skew is a contrarian caution signal that a pullback may be near.
What does flat or call-side skew tell me on RELIANCE?
A flat RELIANCE skew signals complacency — puts and calls price at similar IV, meaning little hedging demand and often a late-stage rally. Call-side or reverse skew, where OTM calls out-price puts, points to speculative upside demand or squeeze risk. Both are unusual for indices and worth watching as sentiment extremes.
How often does the RELIANCE volatility skew chart update?
During NSE market hours (9:15 AM to 3:40 PM IST) the RELIANCE volatility skew chart refreshes every minute from live option-chain IV across strikes. Outside market hours it shows the last traded session, and historical mode lets you replay the RELIANCE skew curve for any past expiry to study how it behaved around events.
Learn more
Read our guide: Implied Volatility (IV) Explained for Indian F&O Traders