SBIN PE-CE OI Difference | Live Sentiment Gauge
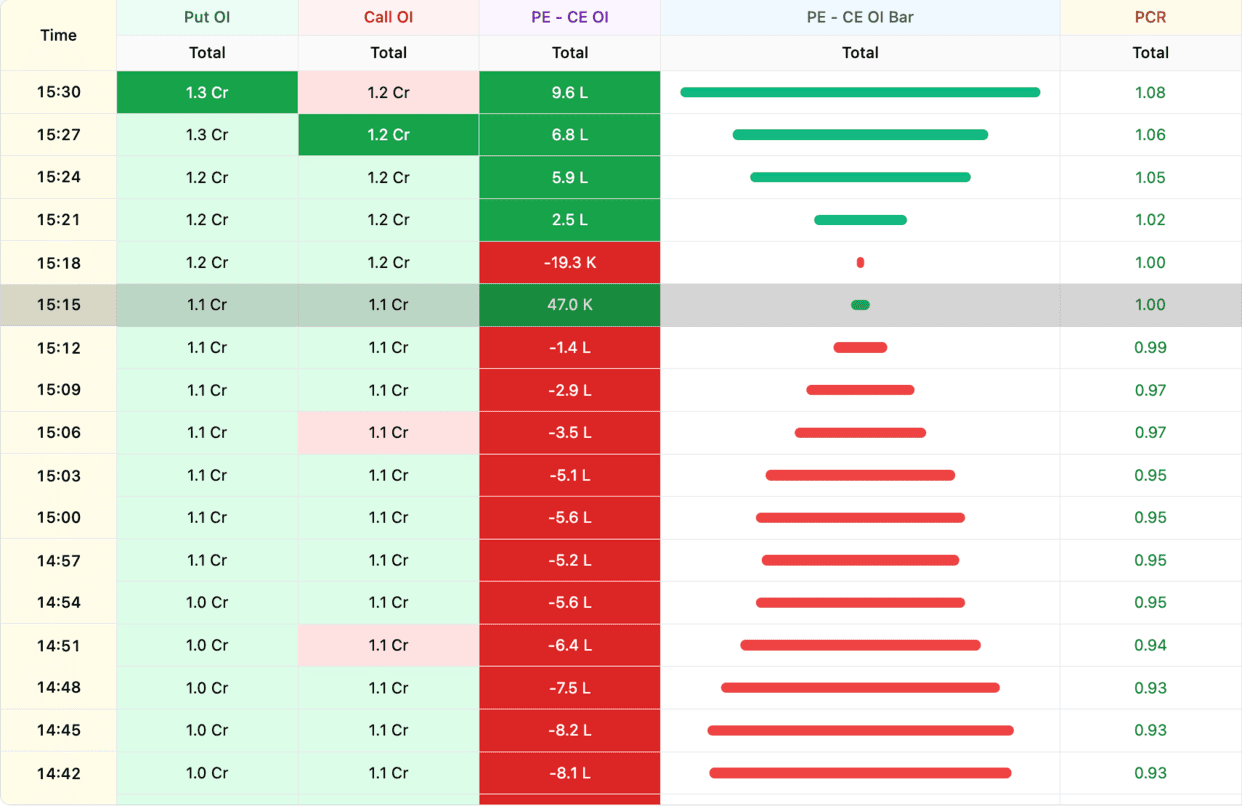
PE minus CE open interest for SBIN is one of the simplest yet most directional sentiment gauges in Indian F&O. It subtracts total call OI from total put OI across the SBIN option chain — a positive difference means more puts are being written, a negative difference means more calls are being written. Because writers are predominantly institutional, the sign and magnitude of this difference tell you where professional money is committing capital.
On SBIN, a sharply rising PE-CE difference through the session is a real time bullish signal — put writers are defending lower strikes with increasing conviction. A falling or deeply negative difference is bearish positioning. The speed of the change matters: a gradual drift reflects steady accumulation, while a sharp flip in direction usually follows a surprise macro or stock-specific event and signals a regime change in SBIN sentiment.
Trading SBIN with PE-CE difference
Option sellers use the SBIN PE-CE difference to pick the right side to write: when the difference is heavily positive, OTM puts tend to hold and are safer to sell than OTM calls. Directional traders use the intraday slope — a steepening positive slope in the first hour of SBIN trade is one of the most reliable bullish confirmations the option chain gives. Reversals in the slope often precede reversals in spot by 15-30 minutes. Live mode streams the SBIN PE-CE difference in real time.
Combine PE-CE difference with our Call vs Put OI Chart, PCR Tracker, and Open Interest Analysis tools for a complete SBIN sentiment picture on NSE F&O.
No data |
State Bank of India (SBIN) PE-CE Difference: Understanding the Gap
What is PE-CE Difference for SBIN?
PE-CE Difference is the simple arithmetic gap between put open interest and call open interest for State Bank of India (SBIN) — Put OI minus Call OI. A positive number means put OI is larger. A negative number means call OI is larger. Unlike a ratio, the difference shows the absolute magnitude of the imbalance, which is often more visually meaningful.
Why use the difference instead of a ratio
Ratios can be misleading when both values are small or both are very large. A ratio of 1.5 means very different things when total OI is 10 lakh versus 100 lakh. The difference directly shows how much more of one side exists. For SBIN trading decisions, the absolute gap often matters more than proportion.
How to read the chart on SBIN
The PE-CE Difference chart plots the gap over time. Rising line means put OI is growing faster than call OI — bullish. Falling line means call OI is growing faster — bearish. A line crossing zero is a sentiment transition. These visual signals are quick to read and act on for State Bank of India trading.
First use of the SBIN tool today
As of 6 October 2026, open the chart and note the current PE-CE Difference value. Is it positive (bullish bias) or negative (bearish bias)? How does today compare to yesterday? This simple check in under a minute sets your directional context for SBIN trades.
State Bank of India (SBIN) PE-CE Difference: Multi-Day Patterns
Why multi-day patterns are more reliable on SBIN
Single-day PE-CE changes can be noisy. Multi-day patterns filter noise and reveal underlying trends. Look at how PE-CE Difference has evolved over 5-7 sessions. A consistent direction during this period is far more reliable than one day's movement for making decisions on State Bank of India.
5-day rising pattern on SBIN
PE-CE Difference rising over 5 sessions signals sustained bullish positioning. Fresh put writing has been consistent. Institutional bias is clearly positive. These multi-day trends typically continue for another 3-5 sessions before weakening. Trade aligned with the direction.
5-day falling pattern on SBIN
PE-CE Difference falling over 5 sessions signals sustained bearish positioning. Call writing has been building consistently. Expect continued pressure on SBIN price. Short positions have tailwind from the options market. Respect the persistence of the signal.
Pattern transitions as of 6 October 2026
When a multi-day pattern breaks, it signals a regime change. A 5-day rising trend suddenly flipping to declining means the bullish positioning is unwinding. This transition is an early warning for bulls and an entry signal for bears. Watch for transitions in addition to the main patterns.
State Bank of India (SBIN) PE-CE Difference: Frequently Asked Questions
What exactly does PE-CE Difference measure?
It measures the arithmetic difference between put open interest and call open interest for State Bank of India. Positive values mean put OI is larger. Negative values mean call OI is larger. The absolute magnitude of the difference shows the strength of the imbalance. The chart plots this value over time.
How does it differ from PCR on SBIN?
PCR is a ratio (put OI divided by call OI). PE-CE Difference is a subtraction (put OI minus call OI). Both measure put-call balance but in different units. Ratios are percentage-based; differences are absolute. Both have value, and using them together gives complementary perspectives.
When should I check the chart?
For positional traders, once per day is enough (end-of-day snapshot). For active intraday traders, check at open, midday, and close. For active scalpers, continuous monitoring during sessions. Match frequency to your trading timeframe on SBIN.
Is the tool suitable for beginners on SBIN as of 6 October 2026
Yes. The PE-CE Difference is one of the simplest volatility and sentiment tools to understand. Beginners can start by observing the chart for a few weeks, noting how the difference moves and what price did. After observation, gradual integration into actual trading decisions is natural.
PE-CE Difference: Video Walkthrough
SBIN PE vs CE premium skew: quick reference
| Premium skew | What it shows | Sentiment read |
|---|---|---|
| PE premium >> CE (steep put skew) | Heavy demand for downside puts | Risk-off; active hedging, defensive-to-bearish tilt |
| PE premium > CE (normal skew) | Routine protective bias on SBIN | Mildly cautious; orderly, healthy market |
| PE ≈ CE (flat skew) | Puts and calls priced alike | Neutral; balanced expectations, no directional lean |
| CE premium ≥ PE (skew narrowing) | Upside demand catching up to puts | Bullish; momentum building, complacency rising |
| CE premium >> PE (call skew) | Traders chasing calls, downside left cheap | Greedy/euphoric; upside chase, watch for froth |
Index and large-cap SBIN options almost always carry some put skew, so read changes rather than the absolute gap: a widening PE-over-CE premium signals rising fear and hedging, while a narrowing or inverted gap signals a chase for upside. Pair this skew read with the OI-based PE-CE difference chart above, which shows where that positioning is actually being built on SBIN.
How to read the PE-CE Difference chart
- Select symbol and expiry — Pick Nifty, BankNifty, or an F&O stock. Check both weekly and monthly expiries separately.
- Check the sign — Positive (put OI > call OI) is bullish bias. Negative is bearish bias. Zero is balanced.
- Watch the slope — Rising means puts being written faster (bullish). Falling means calls being written faster (bearish). Slope direction matters more than absolute level.
- Identify first-hour trend — The first hour of trade usually sets the day's PE-CE direction. A clear slope by 10:30 IST often dictates intraday bias.
- Look for slope reversals — Sharp flips in slope (bullish to bearish or vice versa) often precede price reversals by 15-30 minutes.
SBIN PE-CE Difference — Frequently Asked Questions
What is SBIN PE-CE Difference?
SBIN PE-CE difference is total put open interest minus total call open interest across the option chain. A positive, rising value means puts are being written faster than calls — bullish institutional positioning that defends lower strikes. A negative value means calls dominate — bearish positioning. The sign and size reveal where option writers are committing capital.
How to trade using SBIN PE-CE difference?
Read the slope, not just the level. On SBIN, a steepening positive PE-CE slope in the first hour is one of the option chain's most reliable bullish confirmations, while a sharp downward flip warns of a bearish regime change. Sellers use a heavily positive difference to favour writing OTM puts over OTM calls.
What does the SBIN put-call premium skew tell me?
Compare the put and call premium at equidistant strikes. When SBIN put premiums trade far richer than calls (steep put skew), the market is paying up for downside protection — a fearful, risk-off read. When call premiums richen toward or above puts, traders are chasing upside and downside hedging is cheap — a bullish, complacent read.
How often does the SBIN PE-CE difference update?
During NSE market hours (9:15 AM to 3:40 PM IST) the SBIN PE-CE difference refreshes every minute from the live option chain, so you watch put and call OI shift in real time. Outside market hours it shows the last traded session, and historical mode lets you replay any past SBIN expiry.
Should I read weekly or monthly SBIN PE-CE difference?
Check both. Weekly-expiry SBIN PE-CE difference reflects short-term, event-driven positioning and moves fast; monthly-expiry difference shows deeper institutional commitment. They often disagree — weekly can be neutral while monthly is strongly bullish. Viewing each expiry separately, rather than a blended chain, gives a cleaner picture of SBIN sentiment on NSE.