FINNIFTY PE-CE OI Difference | Live Sentiment Gauge
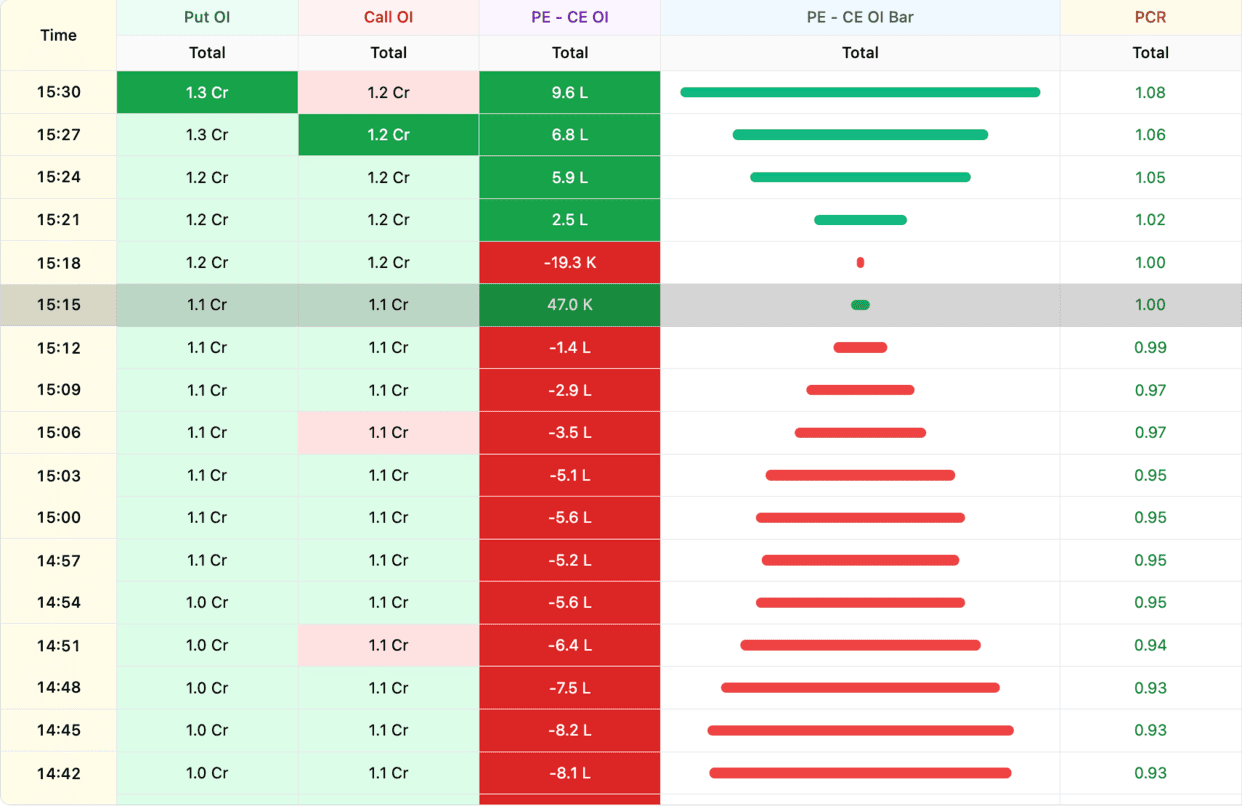
PE minus CE open interest for FINNIFTY is one of the simplest yet most directional sentiment gauges in Indian F&O. It subtracts total call OI from total put OI across the FINNIFTY option chain — a positive difference means more puts are being written, a negative difference means more calls are being written. Because writers are predominantly institutional, the sign and magnitude of this difference tell you where professional money is committing capital.
On FINNIFTY, a sharply rising PE-CE difference through the session is a real time bullish signal — put writers are defending lower strikes with increasing conviction. A falling or deeply negative difference is bearish positioning. The speed of the change matters: a gradual drift reflects steady accumulation, while a sharp flip in direction usually follows a surprise macro or stock-specific event and signals a regime change in FINNIFTY sentiment.
Trading FINNIFTY with PE-CE difference
Option sellers use the FINNIFTY PE-CE difference to pick the right side to write: when the difference is heavily positive, OTM puts tend to hold and are safer to sell than OTM calls. Directional traders use the intraday slope — a steepening positive slope in the first hour of FINNIFTY trade is one of the most reliable bullish confirmations the option chain gives. Reversals in the slope often precede reversals in spot by 15-30 minutes. Live mode streams the FINNIFTY PE-CE difference in real time.
Combine PE-CE difference with our Call vs Put OI Chart, PCR Tracker, and Open Interest Analysis tools for a complete FINNIFTY sentiment picture on NSE F&O.
No data |
Nifty Financial Services (FINNIFTY) PE-CE Difference: Signals from the Trend
Why trend matters more than level on FINNIFTY
The current PE-CE Difference value is one number. The trend — how it has been moving over days — is the signal. A difference of +5 lakh rising from +2 lakh is bullish momentum. A difference of +5 lakh falling from +8 lakh is weakening bullish pressure. Direction of change is what drives actionable signals on Nifty Financial Services.
Bullish trend on FINNIFTY
When PE-CE Difference is rising consistently over 3-5 sessions, bullish positioning is strengthening. Put OI is growing faster than call OI. Smart money is building support at lower strikes and abandoning call writing at upper strikes. These trends often precede price gains by 1-3 days.
Bearish trend on FINNIFTY
When PE-CE Difference is falling consistently, bearish positioning is strengthening. Call OI is dominating. Traders are capping upside more than defending downside. These trends often precede price declines or stagnation. Reduce bullish exposure when the trend shifts down persistently.
Trend break signals on FINNIFTY as of 6 October 2026
A sustained bullish or bearish trend eventually breaks. The break is often a warning of a reversal. If PE-CE Difference has been rising for 5 days and suddenly drops sharply, the bullish setup is losing steam. Watch for these breaks — they often precede price reversals and give you early exit signals.
Nifty Financial Services (FINNIFTY) PE-CE Difference: Divergence Analysis
What is a divergence on the FINNIFTY chart?
Divergence happens when price and PE-CE Difference move in opposite directions. Price rising while PE-CE Difference falls = the rally lacks bullish OI support. Price falling while PE-CE rises = the decline is being absorbed by put writers. Both are signals that the current move may reverse.
Bullish divergence on FINNIFTY
A bullish divergence: Nifty Financial Services price is making new lows while PE-CE Difference is making higher lows. Even as price falls, put OI is growing faster than call OI — fresh bullish commitment is developing underneath the decline. This is an early signal of a reversal. Prepare for long entries.
Bearish divergence on FINNIFTY
A bearish divergence: price making new highs while PE-CE Difference is making lower highs. Even as price rises, call OI is catching up or exceeding put OI growth. The rally lacks confirmation from the options market. Prepare for short entries or exit longs.
Trading divergences on FINNIFTY as of 6 October 2026
Divergences are leading indicators — they appear before price reverses. Do not enter solely on divergence; wait for price confirmation. A reversal candle or key level break combined with the divergence is the high-probability setup. Patience for confirmation reduces false signals.
Nifty Financial Services (FINNIFTY) PE-CE Difference: Daily Routine
Pre-market check on FINNIFTY
Open the chart and note yesterday's closing PE-CE Difference. Compare to the 5-day average. Is current reading above or below average? Bullish bias (above) or bearish (below)? This sets your framework for today.
Opening-hour monitoring on FINNIFTY
Watch how PE-CE Difference changes in the first 30-60 minutes. A rapid shift signals overnight institutional decisions being executed. Align with the shift direction — morning bullish shift suggests long bias, bearish shift suggests short bias.
Afternoon check on FINNIFTY
Around 2:00 PM, check whether the morning's signal is holding. If yes, continue with existing bias. If the signal is weakening or reversing, reassess open positions. The late-session read often gives you signals for overnight holds.
End-of-day review as of 6 October 2026
At market close, note the final PE-CE Difference and document any significant patterns from the day. Compare to expectations. Was the signal correct? Did you trade it well? These reviews build your trading skill over time on Nifty Financial Services.
PE-CE Difference: Video Walkthrough
FINNIFTY PE vs CE premium skew: quick reference
| Premium skew | What it shows | Sentiment read |
|---|---|---|
| PE premium >> CE (steep put skew) | Heavy demand for downside puts | Risk-off; active hedging, defensive-to-bearish tilt |
| PE premium > CE (normal skew) | Routine protective bias on FINNIFTY | Mildly cautious; orderly, healthy market |
| PE ≈ CE (flat skew) | Puts and calls priced alike | Neutral; balanced expectations, no directional lean |
| CE premium ≥ PE (skew narrowing) | Upside demand catching up to puts | Bullish; momentum building, complacency rising |
| CE premium >> PE (call skew) | Traders chasing calls, downside left cheap | Greedy/euphoric; upside chase, watch for froth |
Index and large-cap FINNIFTY options almost always carry some put skew, so read changes rather than the absolute gap: a widening PE-over-CE premium signals rising fear and hedging, while a narrowing or inverted gap signals a chase for upside. Pair this skew read with the OI-based PE-CE difference chart above, which shows where that positioning is actually being built on FINNIFTY.
How to read the PE-CE Difference chart
- Select symbol and expiry — Pick Nifty, BankNifty, or an F&O stock. Check both weekly and monthly expiries separately.
- Check the sign — Positive (put OI > call OI) is bullish bias. Negative is bearish bias. Zero is balanced.
- Watch the slope — Rising means puts being written faster (bullish). Falling means calls being written faster (bearish). Slope direction matters more than absolute level.
- Identify first-hour trend — The first hour of trade usually sets the day's PE-CE direction. A clear slope by 10:30 IST often dictates intraday bias.
- Look for slope reversals — Sharp flips in slope (bullish to bearish or vice versa) often precede price reversals by 15-30 minutes.
FINNIFTY PE-CE Difference — Frequently Asked Questions
What is FINNIFTY PE-CE Difference?
FINNIFTY PE-CE difference is total put open interest minus total call open interest across the option chain. A positive, rising value means puts are being written faster than calls — bullish institutional positioning that defends lower strikes. A negative value means calls dominate — bearish positioning. The sign and size reveal where option writers are committing capital.
How to trade using FINNIFTY PE-CE difference?
Read the slope, not just the level. On FINNIFTY, a steepening positive PE-CE slope in the first hour is one of the option chain's most reliable bullish confirmations, while a sharp downward flip warns of a bearish regime change. Sellers use a heavily positive difference to favour writing OTM puts over OTM calls.
What does the FINNIFTY put-call premium skew tell me?
Compare the put and call premium at equidistant strikes. When FINNIFTY put premiums trade far richer than calls (steep put skew), the market is paying up for downside protection — a fearful, risk-off read. When call premiums richen toward or above puts, traders are chasing upside and downside hedging is cheap — a bullish, complacent read.
How often does the FINNIFTY PE-CE difference update?
During NSE market hours (9:15 AM to 3:40 PM IST) the FINNIFTY PE-CE difference refreshes every minute from the live option chain, so you watch put and call OI shift in real time. Outside market hours it shows the last traded session, and historical mode lets you replay any past FINNIFTY expiry.
Should I read weekly or monthly FINNIFTY PE-CE difference?
Check both. Weekly-expiry FINNIFTY PE-CE difference reflects short-term, event-driven positioning and moves fast; monthly-expiry difference shows deeper institutional commitment. They often disagree — weekly can be neutral while monthly is strongly bullish. Viewing each expiry separately, rather than a blended chain, gives a cleaner picture of FINNIFTY sentiment on NSE.