INFY Max Pain Today 2026 | Live NSE Calculator
Max pain for INFY is the strike price where the maximum number of option writers would inflict the most loss on option buyers at expiry. Historical NSE data on INFY expiries backs up the old market wisdom here: the underlying tends to gravitate toward this strike as expiry approaches, because option writers (who are mostly institutions) hedge their positions to push settlement toward the zone of least payout.
Our tool calculates the INFY max pain level in real time by summing the total open interest value on the call and put sides for every strike, then identifying the strike where the combined loss to option holders is highest. We also surface the second and third most painful strikes, which traders can watch as alternate magnets if spot diverges from the primary level. In live mode, you can see how the max pain strike shifted through the expiry cycle and whether the final settlement landed near it.
How to trade INFY around max pain
Option sellers use INFY max pain to structure strangles and iron condors around the pain point, expecting spot to stay in range. Directional traders read it another way: if spot is far from max pain early in the expiry, a move back toward it can be a high-probability setup. Max pain is most reliable on liquid INFY monthly expiries and in the final week of the cycle. It's weakest in the first week, when the OI distribution is still forming.
Combine max pain with our Put-Call Ratio, Open Interest Analysis, and Live Option Chain tools for complete INFY expiry positioning insight on NSE F&O.
Frequently Asked Questions - Max Pain Analysis
Everything you need to know about Max Pain for NIFTY
Max Pain for NIFTY is the strike price at which the maximum number of options (both calls and puts) would expire worthless, causing maximum financial loss to option holders and maximum profit to option writers. This level represents the theoretical price where market makers and option writers would prefer the underlying to settle at expiration.
Max Pain for NIFTY is calculated by determining the strike price that would result in the lowest total value of outstanding options at expiration. The calculation involves:
1. Call Pain Calculation: For each strike below the current price, multiply the open interest by the intrinsic value difference
2. Put Pain Calculation: For each strike above the current price, multiply the open interest by the intrinsic value difference
3. Total Pain: Sum of call pain and put pain for each strike price
4. Max Pain Strike: The strike with the minimum total pain value
Our system processes real-time open interest data for NIFTY to provide accurate Max Pain calculations updated every minutes during market hours.
Max Pain is crucial for NIFTY trading because:
• Price Gravitational Effect: NIFTY tends to gravitate toward the Max Pain level as expiration approaches
• Market Maker Influence: Large option writers often have significant influence on underlying price movement
• Risk Management: Helps traders understand where institutional money is positioned
• Expiry Strategy: Critical for weekly and monthly expiry trading strategies
• Sentiment Analysis: When NIFTY trades significantly above or below Max Pain, it indicates strong directional bias
This analysis helps in making informed trading decisions.
When NIFTY price deviates from Max Pain:
Above Max Pain:
• Bullish sentiment - buyers are in control
• Call option writers may face losses
• Market may resist moving higher due to gamma hedging
• Often indicates strong upward momentum
Below Max Pain:
• Bearish sentiment - sellers dominate
• Put option writers may face losses
• Market may resist moving lower due to gamma hedging
• Often indicates strong downward pressure
Near Max Pain:
• Neutral sentiment - balanced market
• High probability of price gravitating toward Max Pain at expiry
• Lower volatility expected
NIFTY Max Pain data is updated with the following frequency:
Historical Mode:
• End-of-day data for selected historical dates
• Complete historical analysis available for backtesting
To get a complete picture of NIFTY options market, use these complementary tools:
Track option open interest changes and build-up patterns for NIFTY
Analyze Put-Call parity and premium differences for NIFTY options
Real-time option chain with Greeks and implied volatility for NIFTY
Monitor PCR trends and market sentiment indicators for NIFTY
Pro Tip: Use Max Pain alongside Open Interest and PCR analysis for comprehensive NIFTY options strategy development.
Max Pain is not a direct price prediction tool, but provides valuable insights for NIFTY:
What Max Pain CAN do:
• Indicate potential support/resistance levels around the Max Pain strike
• Show where option writers prefer NIFTY to settle
• Identify unusual option activity and institutional positioning
• Help time option entries and exits
What Max Pain CANNOT do:
• Predict exact price movements or direction
• Account for sudden news or market events
• Override strong fundamental or technical factors
• Guarantee price will reach Max Pain level
Best Practice: Use Max Pain for NIFTY as one component of a comprehensive analysis including technical analysis, market sentiment, and fundamental factors.
Effective NIFTY options trading strategies using Max Pain:
Strategy 1 - Mean Reversion:
• When NIFTY is far from Max Pain, expect price to move toward the Max Pain strike
• Sell options with strikes away from Max Pain
• Buy options with strikes near Max Pain
Strategy 2 - Expiry Week Trading:
• Monitor how close NIFTY is to Max Pain before expiry
• Adjust positions based on probability of reaching the Max Pain strike
• Use for iron condor and butterfly strategies
Strategy 3 - Risk Management:
• Avoid selling options when NIFTY is very close to Max Pain
• Use Max Pain as a reference for stop-loss levels
• Monitor changes in Max Pain throughout the trading session
Always combine Max Pain analysis with proper risk management and position sizing.
Need more help with options trading strategies?
Infosys Ltd (INFY) Max Pain: What It Means and How It Is Calculated
What is Max Pain for INFY?
Max Pain is the strike price at which the total loss to Infosys Ltd (INFY) option buyers is greatest at expiry — or equivalently, the strike at which option writers (sellers) pay out the least. It is derived directly from the live open interest across every INFY strike. The market does not actually "target" this level, but historical observation shows that prices often drift toward it as expiry approaches because of systematic hedging by option writers.
How is the INFY Max Pain number calculated?
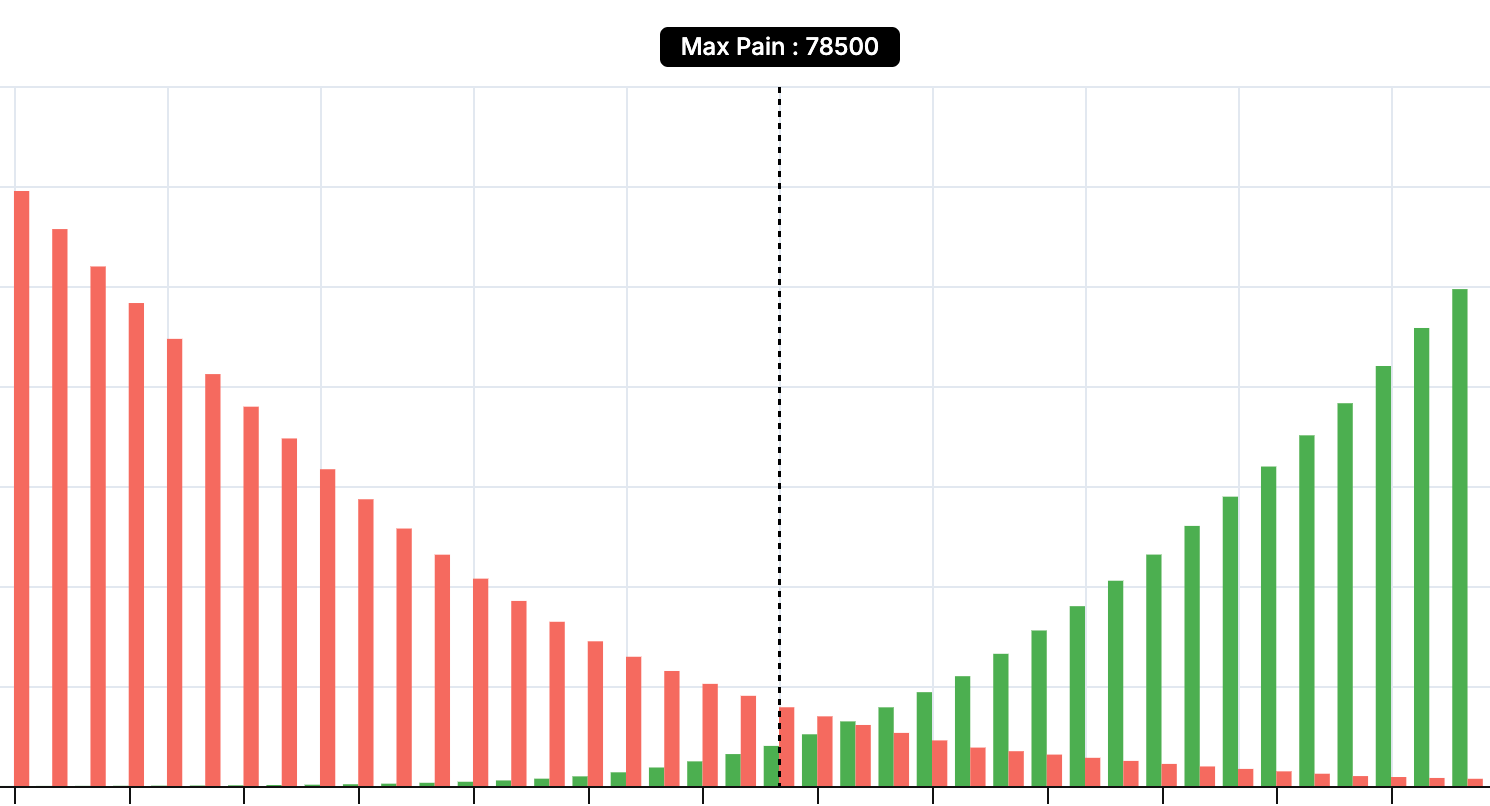
For each strike in the INFY option chain, the tool calculates what all call buyers and put buyers would collectively lose if INFY settled exactly at that strike. The strike with the smallest combined loss across all call and put buyers is the Max Pain strike. The calculation uses real-time open interest — so Max Pain shifts as OI changes during the session. On the Infosys Ltd chart, the Max Pain strike is highlighted as a reference line.
Why Max Pain matters for INFY traders
As a NIFTY constituent, Infosys Ltd sees deep options activity from both institutions and retail. When option writers build large positions at high-OI strikes, they hedge their exposure by trading the underlying. As expiry nears, this hedging activity often pulls INFY price toward the Max Pain level. Knowing this reference point helps traders anticipate where Infosys Ltd is likely to settle and plan trades accordingly.
Using the INFY Max Pain tool as of 13 October 2026
Open the Max Pain tool and check the current strike. Compare it against the live INFY spot price. If spot is within 0.5% of Max Pain, expect range-bound behaviour into expiry. If spot is 1-2% away, watch for a gradual drift toward Max Pain over the next 2-3 sessions. If spot is more than 3% away, macro forces are probably stronger than the hedging pull and Max Pain becomes less reliable. This simple check adds context to every Infosys Ltd trading decision.
Infosys Ltd (INFY) Max Pain: Multi-Expiry Comparison
Why compare INFY Max Pain across expiries?
Infosys Ltd has multiple active expiries — weekly and monthly. Each one has its own Max Pain value. By comparing them, you get a short-term vs medium-term picture. The current week's Max Pain reflects short-term positioning. The current month's Max Pain reflects broader institutional positioning. When both agree (both above or below spot), the signal is unified. When they diverge, the market is saying different things at different timeframes.
Reading INFY weekly vs monthly Max Pain
If INFY weekly Max Pain is 22500 but monthly Max Pain is 23000, the short-term pull is toward 22500 (this week) while the medium-term pull is toward 23000 (this month). A trader operating on a weekly timeframe focuses on 22500. A positional trader focuses on 23000. Both are valid, but the timeframe determines which Max Pain matters to your specific trade.
Divergence signals in INFY Max Pain
A significant divergence between weekly and monthly Max Pain often signals a transition. If weekly Max Pain is 500 points below monthly Max Pain, the week might see a dip before the monthly trend reasserts itself. If weekly is above monthly, the week might see a bounce before the monthly trend resumes lower. These divergences are most actionable in the second week of a monthly cycle when both expiries have meaningful OI.
A practical INFY multi-expiry routine
Monday morning, check Infosys Ltd Max Pain for both the current week and current month. Write both down. Throughout the week, track how the weekly Max Pain evolves relative to the monthly. If they converge (weekly drifts toward monthly), the monthly trend is dominant. If they stay divergent, the week might follow its own path. This quick weekly setup + daily monitoring gives you continuous context for every trade decision. As of 13 October 2026, it takes less than 5 minutes per day.
Infosys Ltd (INFY) Max Pain vs Price Action
When Max Pain and INFY price action agree
The strongest trade setups happen when Max Pain and price action point to the same outcome. For example: Infosys Ltd is in a mild downtrend, resistance is clearly holding on the chart, AND Max Pain is below the current price. Both the price action and the Max Pain are saying "bias lower". Trade the downside with confidence. Stop above the recent swing high. Target the Max Pain level as the first objective.
When they disagree on INFY
The toughest setups are when price action says one thing and Max Pain says another. For example: INFY price is breaking out upward, but Max Pain is far below current levels. Which do you trust? In general, in the short term (intraday), price action wins. In the longer timeframe (expiry week), Max Pain often reasserts. You can trade the breakout with tight stops while respecting that Max Pain is a counter-trend pressure.
INFY Max Pain as a target, not a trigger
One of the most sensible uses of Max Pain is as a profit target rather than an entry trigger. If you are already in a Infosys Ltd position based on price action, Max Pain gives you a natural destination. If you are long and the trend is up, set your target near the nearest overhead Max Pain level. If you are short, target the Max Pain below. This converts a probabilistic signal into a practical profit-taking level.
Combining INFY Max Pain with support-resistance
A classic combination: look for Infosys Ltd support-resistance levels on the chart that coincide with Max Pain. When a technical level and the Max Pain level are at the same strike, the confluence is powerful. Market makers defend the level for hedging reasons, and technical traders defend it for chart reasons. These confluence zones are some of the strongest levels INFY sees. As of 13 October 2026, marking them on your chart before each session gives you a clear framework for trades.
INFY distance from max pain: quick reference
| Spot vs max pain | Positioning | Common reading |
|---|---|---|
| More than 2% above | Call writers under pressure | Strong bullish momentum; trend can override the magnet |
| 0.5% to 2% above | Mild bullish premium | Drift back toward the strike likely as expiry nears |
| Within ±0.5% | Pinned at max pain | Range-bound zone; fastest premium decay, favours sellers |
| 0.5% to 2% below | Put writers under pressure | Mild bearish tilt; upward pull toward INFY max pain |
| More than 2% below | Strong bearish momentum | Downtrend in control; wait for OI confirmation before fading |
These distance bands are rules of thumb from NSE weekly and monthly expiry behaviour, not fixed thresholds. INFY's own volatility decides how meaningful a given gap is. The pull toward max pain is weakest early in the expiry cycle and strongest in the final two sessions, and the live chart above recalculates the strike every minute so you can track the gap in real time.
How StockMojo calculates the INFY max pain level
For every strike in the INFY option chain, StockMojo assumes expiry at exactly that strike and sums the payout all in-the-money calls and puts would owe, weighted by each contract's open interest. Whichever strike leaves writers with the smallest total payout, and buyers with the largest combined loss, is the INFY max pain level.
The calculation runs on open interest only: strikes with zero OI contribute nothing, and recent volume is not weighted, so a level built weeks ago counts the same as one built today. During NSE market hours (09:15 to 15:40 IST) the level recalculates every minute from the live option chain, and it can shift meaningfully intraday as positions build and unwind.
Outside market hours the tool shows the last traded session's level. Historical mode replays how the INFY max pain strike moved through past expiry cycles, so you can compare it against where each expiry actually settled.
How to use the StockMojo Max Pain tool
- Select an index or stock — Pick Nifty, BankNifty, FinNifty, or any F&O stock from the symbol selector at the top of the tool.
- Choose an expiry — Select the expiry you want to analyze: current week, next week, or monthly. The tool defaults to the nearest expiry.
- Read the highlighted max pain strike — The strike with the lowest total writer loss is highlighted. This is the level where option buyers as a group lose the most.
- Compare with current spot price — Look at the difference between max pain and the live underlying price. A large gap creates a stronger 'magnet' setup as expiry approaches.
- Cross-check with PCR and OI buildup — Open the Put Call Ratio and Open Interest tools alongside max pain. Use them together to confirm directional bias before placing a trade.
INFY Max Pain — Frequently Asked Questions
What is INFY max pain today?
Max pain for INFY is the strike price where option buyers collectively lose the most if the contract expires there. Put another way, it's the strike where option writers pay out the least. The tool above computes it live from the INFY NSE option chain open interest and highlights the current max pain strike along with the pain distribution across nearby strikes.
How is INFY max pain calculated?
For every strike in the INFY option chain, the calculator assumes expiry at that strike and sums the intrinsic value all in-the-money calls and puts would pay out, weighted by open interest. Whichever strike leaves writers with the smallest total payout (and buyers with the largest combined loss) is the INFY max pain level. It recalculates as OI shifts.
Does INFY expire at the max pain strike?
Not always, but it lands close often. On liquid NSE expiries, INFY tends to settle within about 1% of the max pain strike in a majority of normal weeks, because option writers hedge to defend the zone of least payout. Event weeks (RBI policy, budget, results) routinely break the pattern, so treat max pain as a magnet, not a guarantee.
What does it mean when INFY trades above or below max pain?
When INFY trades well above max pain, call writers are under pressure and a drift back toward the strike becomes more likely as expiry nears. Trading well below it flips the pressure onto put writers, so the pull works upward instead. Near the strike itself, premiums decay fastest, which favours option sellers. That's why the gap between spot and max pain makes a quick expiry-bias gauge for INFY.
How often does INFY max pain update?
During NSE market hours (9:15 AM to 3:40 PM IST) the INFY max pain level recalculates every minute from live option chain open interest, so the strike can shift intraday as positions build and unwind. Outside market hours the tool shows the last traded session, and historical mode replays max pain for past INFY expiries.
Learn more
Read our guide: Max Pain Theory Explained: The Max Pain Option Level