TCS Implied Volatility (IV) Chart | Live Intraday ATM IV
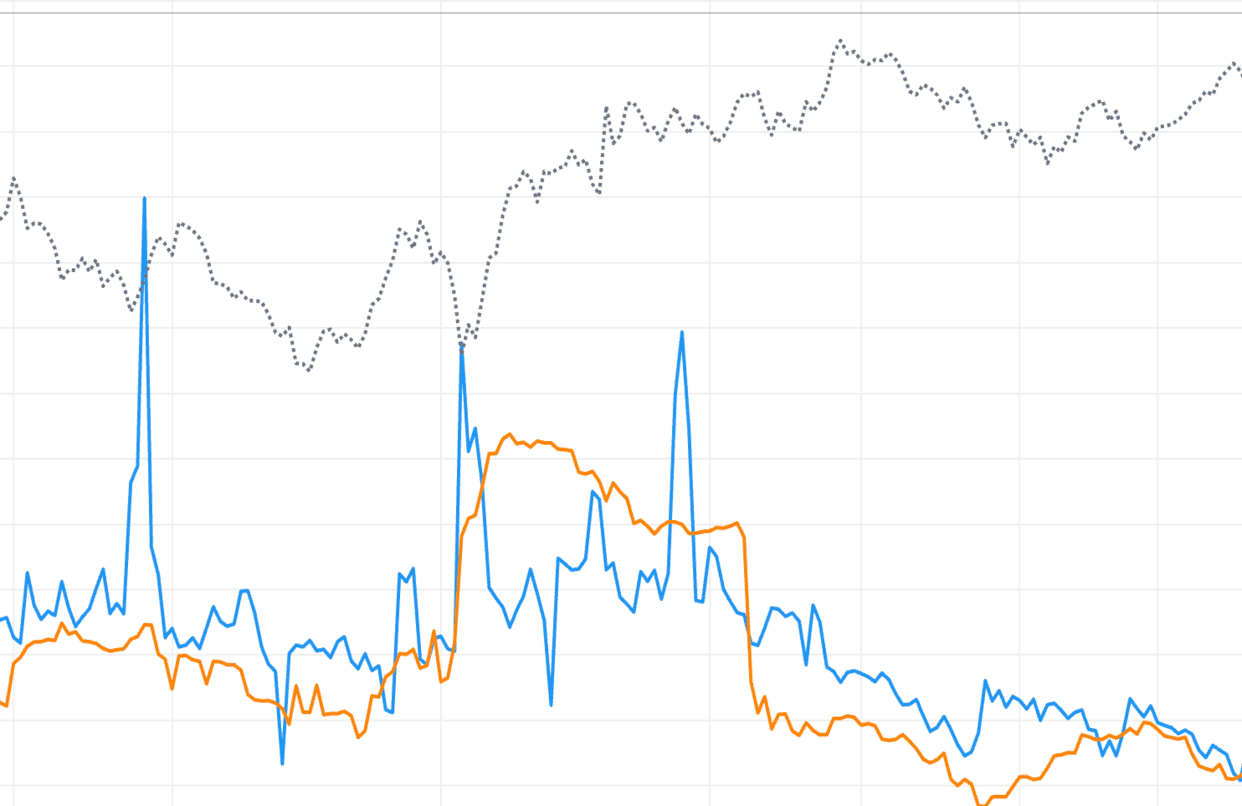
Track intraday ATM implied volatility for TCS. IV is solved every minute from the at-the-money call and put premiums against the synthetic future, giving a clean, real-time read of how much the option market expects TCS to move. The future price is overlaid so you can see volatility and price together.
Use the TCS IV chart to spot volatility expansion and crush as they happen. Rising IV means options are getting more expensive — be cautious buying. Falling IV means premium is deflating — favourable for sellers. Live mode refreshes TCS IV every minute through the NSE session.
Combine with our Straddle Chart, IV/HV/IVP Chart, and Live Option Chain for complete TCS volatility analysis on NSE F&O.
Tata Consultancy Services Ltd (TCS) IV Chart: Opening-Hour Implied Volatility
Why the TCS open matters
The first 30-45 minutes set the volatility tone for the day. Tata Consultancy Services Ltd IV often opens elevated because overnight positioning and gap risk carry into the session, then settles as the market finds its range.
Reading the first-hour TCS IV
If IV drifts lower through the first hour, expect a calmer, range-bound day that favours premium sellers. If it stays high or climbs, the session is likely to be volatile and option buyers may have an edge. The IV line makes this classification quick.
Acting on the TCS open as of 17 September 2026
Note the opening IV level and its early direction before committing to a strategy. A high, rising open argues against selling naked premium; a falling open argues against paying up for long options. Let the first-hour Tata Consultancy Services Ltd IV bias your day.
Tata Consultancy Services Ltd (TCS) IV Chart: Live vs Historical Mode
Live TCS IV
In live mode the Tata Consultancy Services Ltd IV chart refetches and redraws roughly once a minute through NSE hours. It is the tool for in-session decisions — watching expansion, crush, and divergences as they happen.
Historical TCS replay
Historical mode lets you replay any past trading day for the selected expiry. Study how TCS IV behaved around prior quarterly results, board meetings, and major corporate announcements to build pattern recognition you can apply live.
Using both for TCS as of 17 September 2026
Backtest your read in historical mode, then trade it in live mode. Reviewing past Tata Consultancy Services Ltd IV sessions is one of the fastest ways to learn how intraday volatility actually moves around events.
Tata Consultancy Services Ltd (TCS) IV Chart: What Drives the IV Line
Inputs behind TCS IV
The Tata Consultancy Services Ltd IV line moves with three forces: pending events that raise demand for protection, recent realised moves that lift expectations, and broad market sentiment. The chart compresses all of these into one trackable line.
As a NIFTY constituent
As a NIFTY constituent, TCS IV is also sensitive to global cues and cross-asset stress. A spike abroad can lift domestic IV before local price reacts, which is exactly the kind of early signal this chart surfaces.
Reading the drivers on TCS as of 17 September 2026
When IV rises, ask whether it is event-driven (likely to crush), move-driven (may persist), or sentiment-driven (regime shift). Matching the Tata Consultancy Services Ltd IV change to its cause sharpens every options decision.
TCS intraday IV patterns: quick reference
| IV line pattern | What it means | Common trading read |
|---|---|---|
| Steady rise through the session | IV expansion — bigger moves being priced in | Premiums inflating; buying TCS options gets expensive late |
| Sharp vertical drop | IV crush after an event resolves | Sellers capture the collapse; buyers lose extrinsic value fast |
| Rising IV, flat future price | Options market bracing for a move price hasn't made | Classic pre-breakout alert; tighten risk on short premium |
| Falling IV, rising future price | Calm, confident rally | Continuation read; favours short-premium strategies |
| Elevated at open, drifting lower | Overnight gap risk being unwound | Range-bound day likely; theta plus falling IV aids sellers |
| Jumpy line near expiry close | Time-to-expiry collapse destabilises the IV solve | Noise, not signal — treat late expiry-day IV with caution |
These patterns describe how the premium-derived ATM IV line typically behaves inside a single NSE session — tendencies, not guarantees. The live TCS chart above re-solves IV from the ATM call and put premiums every minute, with the future price overlaid, so you can match today's tape to a pattern before committing to a trade.
How to use the StockMojo Implied Volatility Chart
- Select an underlying — Choose Nifty, BankNifty, Sensex, or any F&O stock from the symbol selector.
- Pick live or historical — Use live mode for the current session (auto-refreshing each minute) or historical mode to replay a past trading day.
- Choose an expiry — Select the expiry whose ATM IV you want to track. Near-term expiries react hardest to events; far-term IV is steadier.
- Read the IV line — Watch the IV line for expansion (rising premium expectations) or crush (falling). Note where current IV sits versus earlier in the session.
- Compare IV with the future — Use the overlaid future price to spot divergences — for example IV climbing while price is flat, a classic pre-breakout signal.
TCS Implied Volatility Chart — Frequently Asked Questions
What is TCS implied volatility (IV)?
TCS implied volatility is the market's expectation of future movement, back-solved from ATM option premiums. This chart computes ATM IV every minute from the call and put prices and the synthetic future, so high IV means options are expensive and low IV means they are cheap.
How is TCS ATM IV calculated here?
For each minute, the ATM call and put premiums are fed into the Black-Scholes model against the synthetic future (Strike + Call − Put). Because the option is priced on the forward, call IV and put IV match, so a single IV line is plotted alongside the TCS future price.
What does an intraday TCS IV spike mean?
A sudden IV rise means the market is pricing in more movement — often ahead of an event or during a fast move. After the uncertainty resolves, IV usually crushes back down. Watching TCS IV intraday helps you avoid buying expensive options and time premium selling.
How is this TCS IV chart different from the daily IV/HV/IVP chart?
This chart is intraday: TCS ATM IV is re-solved from option premiums every minute of the session, per expiry. The IV/HV/IVP chart is daily — one end-of-day IV value with IV Rank, IV Percentile and historical volatility over months. Use this tool for in-session timing and the daily chart to judge whether today's TCS IV is high or low overall.
How often does the TCS implied volatility chart update?
During NSE market hours (9:15 AM to 3:40 PM IST) the TCS IV line refetches roughly once a minute and redraws the latest ATM IV point. Outside market hours the chart shows the last completed session, and historical mode lets you replay intraday TCS IV for any past trading day and expiry.