RELIANCE Implied Volatility (IV) Chart | Live Intraday ATM IV
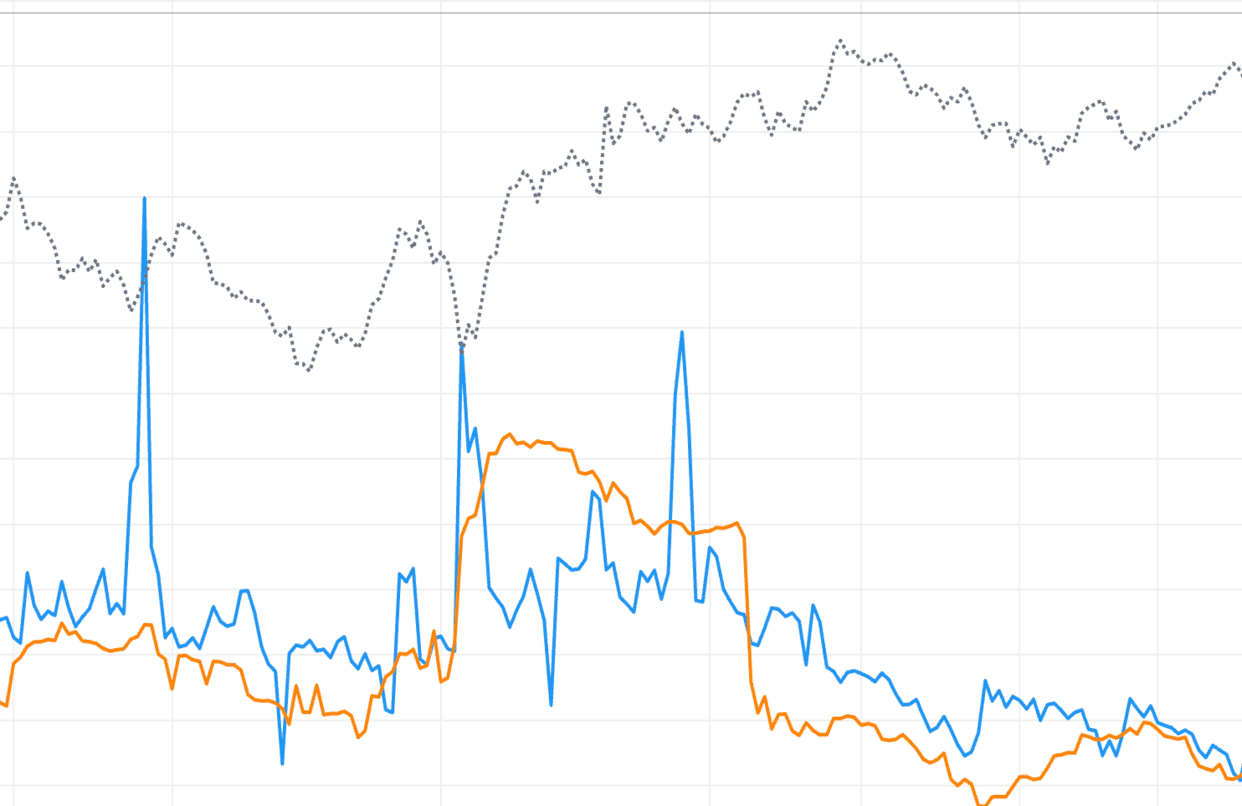
Track intraday ATM implied volatility for RELIANCE. IV is solved every minute from the at-the-money call and put premiums against the synthetic future, giving a clean, real-time read of how much the option market expects RELIANCE to move. The future price is overlaid so you can see volatility and price together.
Use the RELIANCE IV chart to spot volatility expansion and crush as they happen. Rising IV means options are getting more expensive — be cautious buying. Falling IV means premium is deflating — favourable for sellers. Live mode refreshes RELIANCE IV every minute through the NSE session.
Combine with our Straddle Chart, IV/HV/IVP Chart, and Live Option Chain for complete RELIANCE volatility analysis on NSE F&O.
Reliance Industries Ltd (RELIANCE) Implied Volatility Chart: Frequently Asked Questions
Is RELIANCE IV here intraday or daily?
It is intraday. The Reliance Industries Ltd IV line is rebuilt minute by minute from ATM option premiums for the selected expiry, unlike daily IV-rank tools that show one value per day. Use it for in-session timing.
What is a normal RELIANCE IV level?
Normal depends on conditions. As a NIFTY constituent, Reliance Industries Ltd ATM IV is often in the low-to-mid range during calm periods and spikes well above it around quarterly results, board meetings, and major corporate announcements. Read today's level against the session, not an absolute benchmark.
Which tools pair with the RELIANCE IV chart as of 17 September 2026?
Pair it with the Reliance Industries Ltd straddle chart (premium effect of IV), the IV/HV/IVP chart (daily rank and percentile), and the volatility-skew tool (IV across strikes) for a complete volatility view.
Reliance Industries Ltd (RELIANCE) IV Chart: Near vs Far Expiry IV
Switching RELIANCE expiries
Select different expiries to compare how Reliance Industries Ltd ATM IV behaves across the curve. Near-term IV reacts hardest to immediate events; far-term IV is steadier and reflects the broader volatility regime.
Reading the RELIANCE term structure
When near-term IV sits well above far-term IV (backwardation), the market sees imminent event risk for RELIANCE. When far-term IV is higher (contango), near-term conditions are calm. Comparing expiries on this chart reveals which regime you are in.
Strategy implications for RELIANCE as of 17 September 2026
Steep near-term IV favours short-dated premium selling into the event and the subsequent crush. Calm near-term IV with elevated far-term IV can favour longer-dated buys. Switch expiries to read Reliance Industries Ltd term structure before choosing.
Reliance Industries Ltd (RELIANCE) IV Chart: IV and Theta Intraday
How RELIANCE IV and time decay interact
IV sets the size of an option's extrinsic value; theta erodes it as the session passes. For Reliance Industries Ltd positions, both forces act at once — falling IV and theta together accelerate premium loss, which sellers want and buyers fear.
Reading the combined effect on RELIANCE
A flat RELIANCE future with falling IV is the ideal seller's tape: premium melts from both decay and volatility contraction. A rising IV line can offset theta for buyers, keeping long options alive even without an immediate move.
Practical use for RELIANCE as of 17 September 2026
If you are long Reliance Industries Ltd premium, you need IV expansion or a move to overcome theta — watch the IV line for support. If you are short, falling IV plus decay is your tailwind. The chart shows which regime is active.
RELIANCE intraday IV patterns: quick reference
| IV line pattern | What it means | Common trading read |
|---|---|---|
| Steady rise through the session | IV expansion — bigger moves being priced in | Premiums inflating; buying RELIANCE options gets expensive late |
| Sharp vertical drop | IV crush after an event resolves | Sellers capture the collapse; buyers lose extrinsic value fast |
| Rising IV, flat future price | Options market bracing for a move price hasn't made | Classic pre-breakout alert; tighten risk on short premium |
| Falling IV, rising future price | Calm, confident rally | Continuation read; favours short-premium strategies |
| Elevated at open, drifting lower | Overnight gap risk being unwound | Range-bound day likely; theta plus falling IV aids sellers |
| Jumpy line near expiry close | Time-to-expiry collapse destabilises the IV solve | Noise, not signal — treat late expiry-day IV with caution |
These patterns describe how the premium-derived ATM IV line typically behaves inside a single NSE session — tendencies, not guarantees. The live RELIANCE chart above re-solves IV from the ATM call and put premiums every minute, with the future price overlaid, so you can match today's tape to a pattern before committing to a trade.
How to use the StockMojo Implied Volatility Chart
- Select an underlying — Choose Nifty, BankNifty, Sensex, or any F&O stock from the symbol selector.
- Pick live or historical — Use live mode for the current session (auto-refreshing each minute) or historical mode to replay a past trading day.
- Choose an expiry — Select the expiry whose ATM IV you want to track. Near-term expiries react hardest to events; far-term IV is steadier.
- Read the IV line — Watch the IV line for expansion (rising premium expectations) or crush (falling). Note where current IV sits versus earlier in the session.
- Compare IV with the future — Use the overlaid future price to spot divergences — for example IV climbing while price is flat, a classic pre-breakout signal.
RELIANCE Implied Volatility Chart — Frequently Asked Questions
What is RELIANCE implied volatility (IV)?
RELIANCE implied volatility is the market's expectation of future movement, back-solved from ATM option premiums. This chart computes ATM IV every minute from the call and put prices and the synthetic future, so high IV means options are expensive and low IV means they are cheap.
How is RELIANCE ATM IV calculated here?
For each minute, the ATM call and put premiums are fed into the Black-Scholes model against the synthetic future (Strike + Call − Put). Because the option is priced on the forward, call IV and put IV match, so a single IV line is plotted alongside the RELIANCE future price.
What does an intraday RELIANCE IV spike mean?
A sudden IV rise means the market is pricing in more movement — often ahead of an event or during a fast move. After the uncertainty resolves, IV usually crushes back down. Watching RELIANCE IV intraday helps you avoid buying expensive options and time premium selling.
How is this RELIANCE IV chart different from the daily IV/HV/IVP chart?
This chart is intraday: RELIANCE ATM IV is re-solved from option premiums every minute of the session, per expiry. The IV/HV/IVP chart is daily — one end-of-day IV value with IV Rank, IV Percentile and historical volatility over months. Use this tool for in-session timing and the daily chart to judge whether today's RELIANCE IV is high or low overall.
How often does the RELIANCE implied volatility chart update?
During NSE market hours (9:15 AM to 3:40 PM IST) the RELIANCE IV line refetches roughly once a minute and redraws the latest ATM IV point. Outside market hours the chart shows the last completed session, and historical mode lets you replay intraday RELIANCE IV for any past trading day and expiry.